A greenhouse effect demonstration that you can feel with your hand
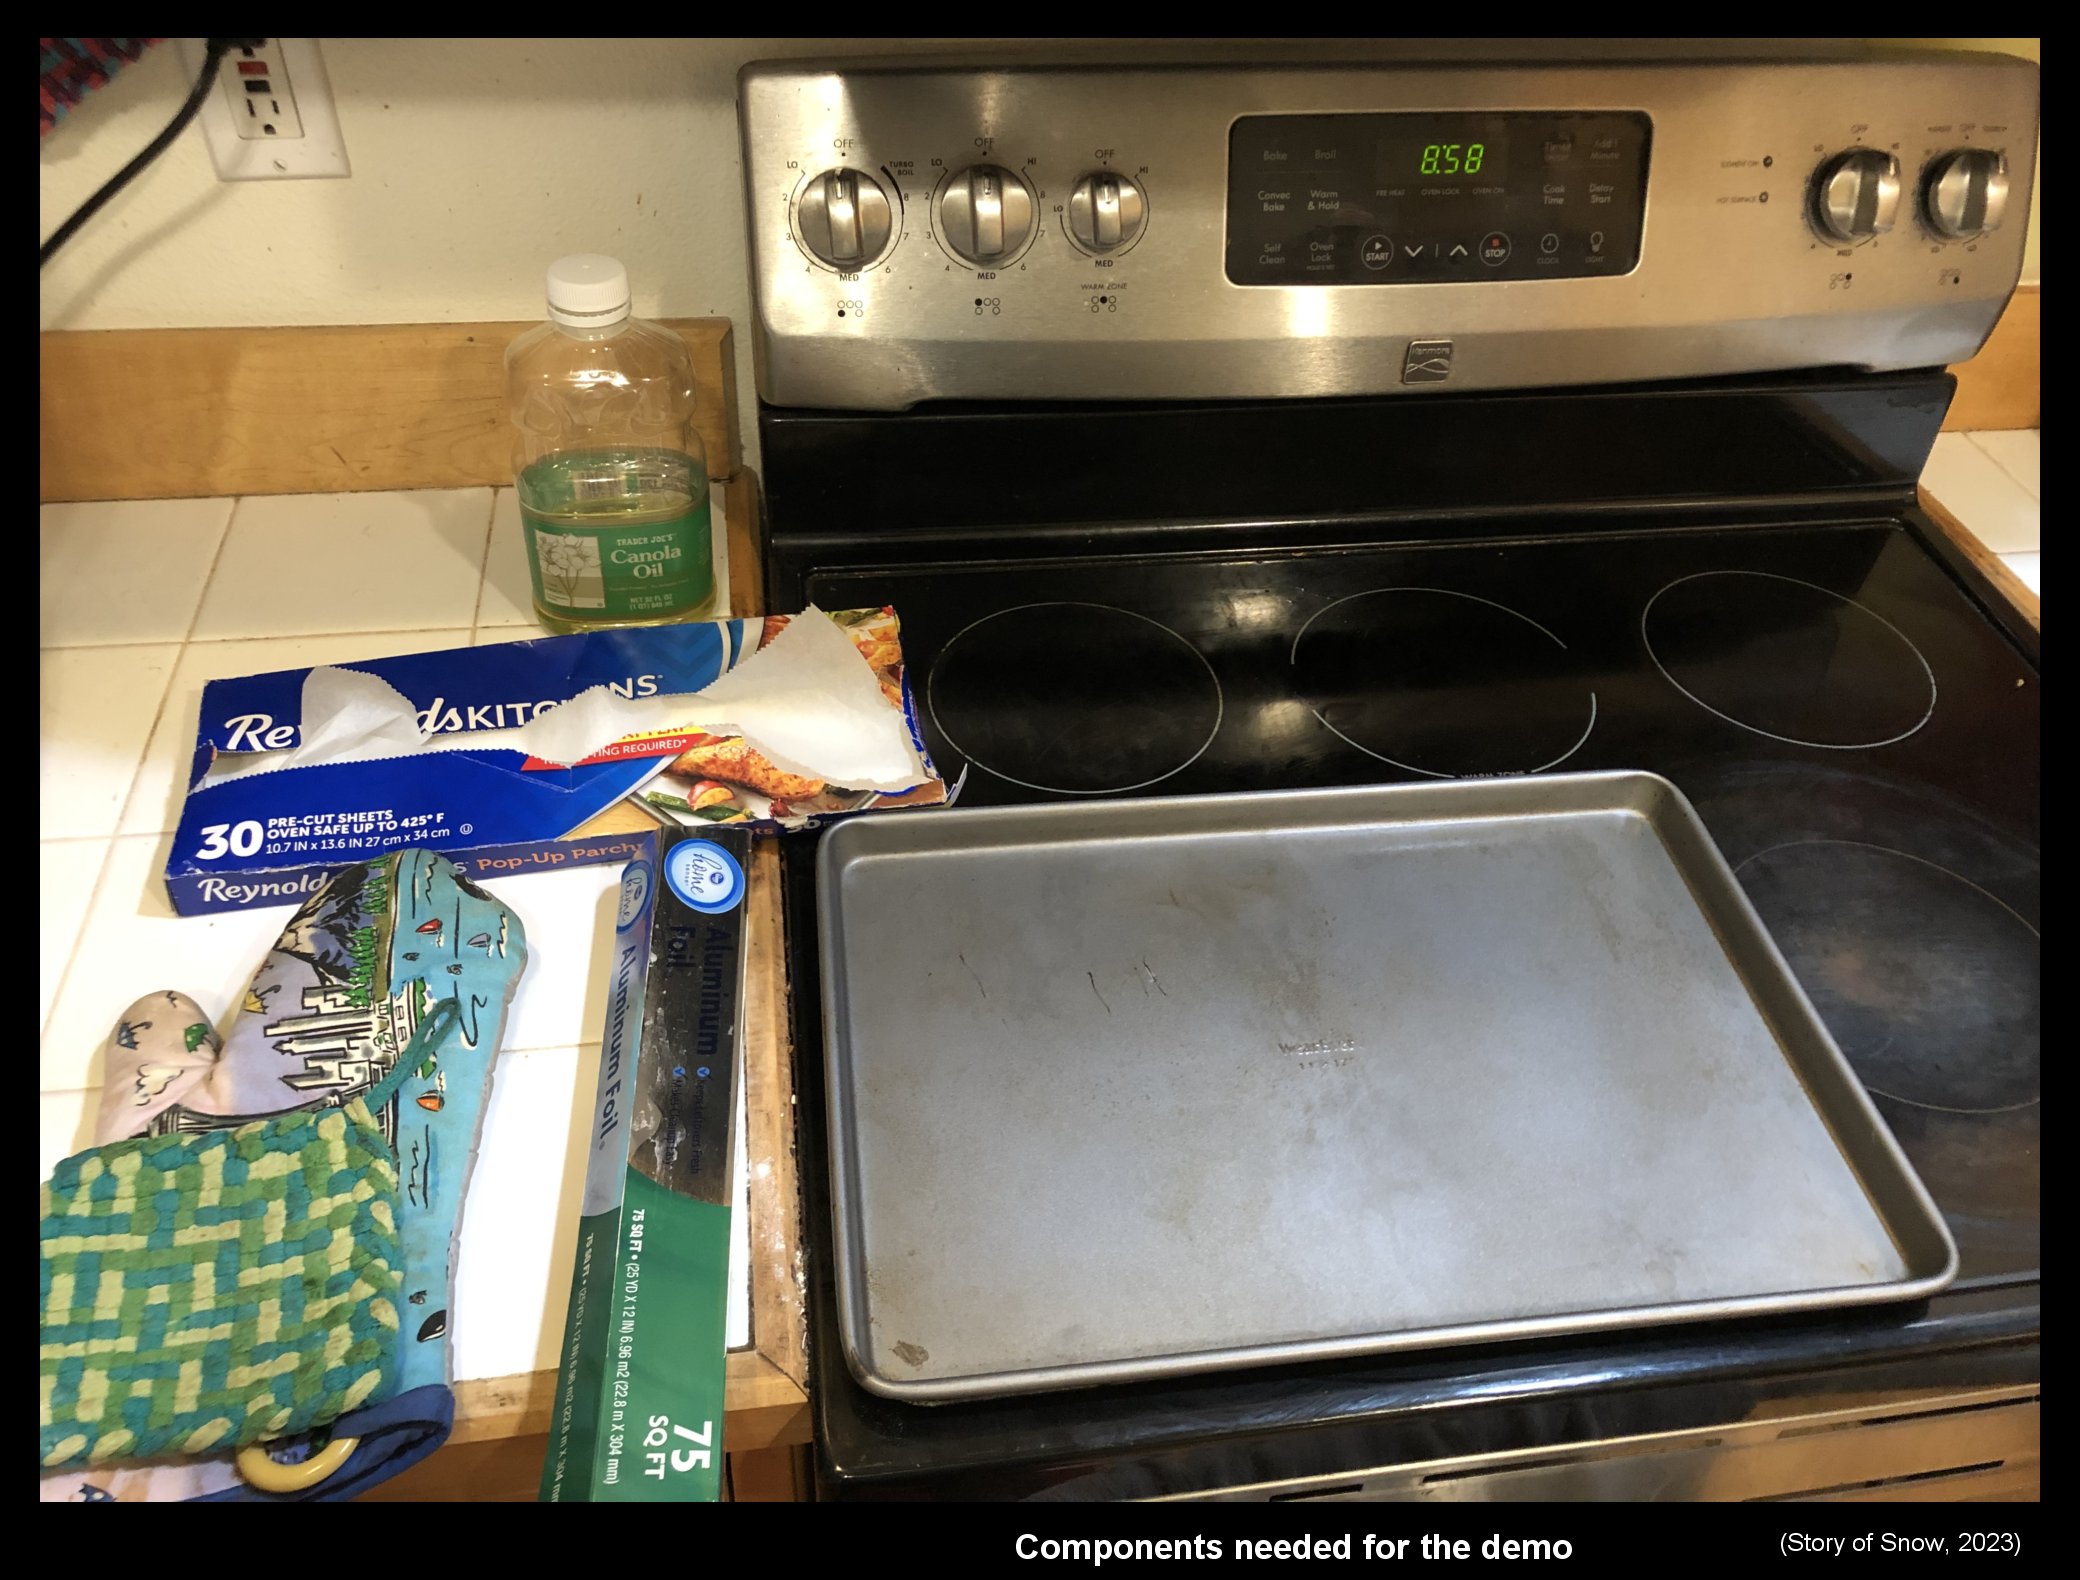
January 18th, 2023Probably most people consider the greenhouse effect as an important, yet subtle, effect on our climate. I suspect though that very few consider it the major effect on our daily weather, amenable to direct sensation, that it really is. Perhaps this lack of appreciation can be partly alleviated with a simple and quick demonstration. Below is my attempt at such a demonstration. This demo focuses on a key aspect of the greenhouse effect. It requires only items typically found in a kitchen yet allows one to directly feel the warming. An added bonus is that the specific phenomenon illustrated also helps explains other phenomena we witness in daily life. Below are all the things you need to do the demo. (click on any pic to enlarge)
What does the greenhouse have to do with snow?
But first, as this is a snow blog, what is the connection to snow? The growth of snow crystals is, except for their being in free-fall, almost exactly the same as the growth of hoar frost on the ground. The hoar frost on the ground occurs when the local greenhouse effect during the evening and night is relatively weak. That is, the local atmosphere above is cloud-free and relatively dry. (Of course, the air at the ground needs to be relatively cold and humid as well.) This connection illustrates one way we directly sense variations in the greenhouse effect through our weather. More on this later.
A key aspect of the greenhouse effect
The greenhouse effect involves several connected concepts, or aspects, a fact that makes the complete effect much more challenging to understand than is commonly appreciated. Nevertheless, we can readily understand one of its crucial aspects: emitted infrared radiation (IR) from the atmosphere directly warms us on the ground. This IR radiation from above, also known as “back radiation”, is not small: indeed, averaged globally and annually, the radiated energy we receive from atmospheric IR is roughly twice that which comes from the sun. (Why do we not notice such a large effect? Because, unlike sunshine, it never stops.) Unfortunately, this is not how the effect is usually presented in the popular literature. For more details about this issue and other greenhouse misconceptions, I urge you to read Alistair Fraser’s excellent and amusing “Bad Greenhouse” page (1), but here I focus on a simple demo.
Simple demos of the effect
Most demos of the greenhouse instead focus on atmospheric absorption of infrared by greenhouse gases. Although absorption of IR is part of the greenhouse effect, to understand how we are warmed at the ground, one needs additional concepts to complete the explanation, concepts that are usually left out of the discussion. More to the point for this blog entry, of the demos that I’ve seen, all of them misrepresent the atmospheric greenhouse. Specifically, instead of illustrating a heating process in the atmosphere, such demos instead illustrate the heating process in a gardener’s greenhouse. This is the wrong effect. If you are skeptical of this claim, consider the highlighted text in the following study (2):
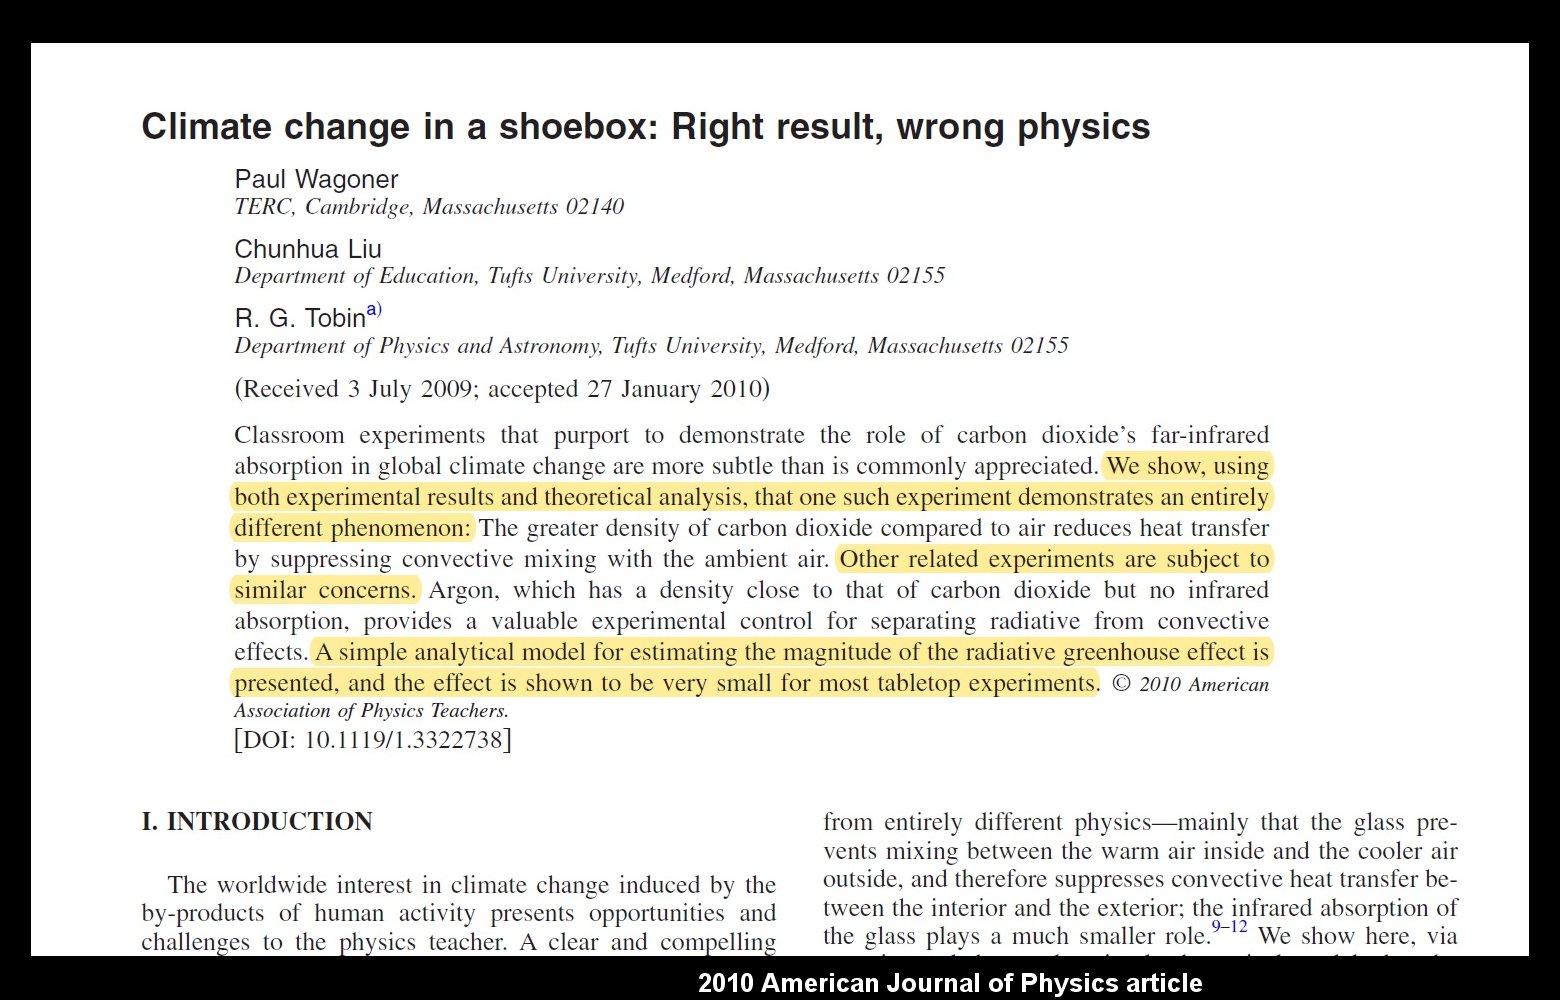
A similar study was published a few years later in the European Journal of Physics. But it is not just the physicists who think the popular demos are wrong, here is a similar study from chemists (3):
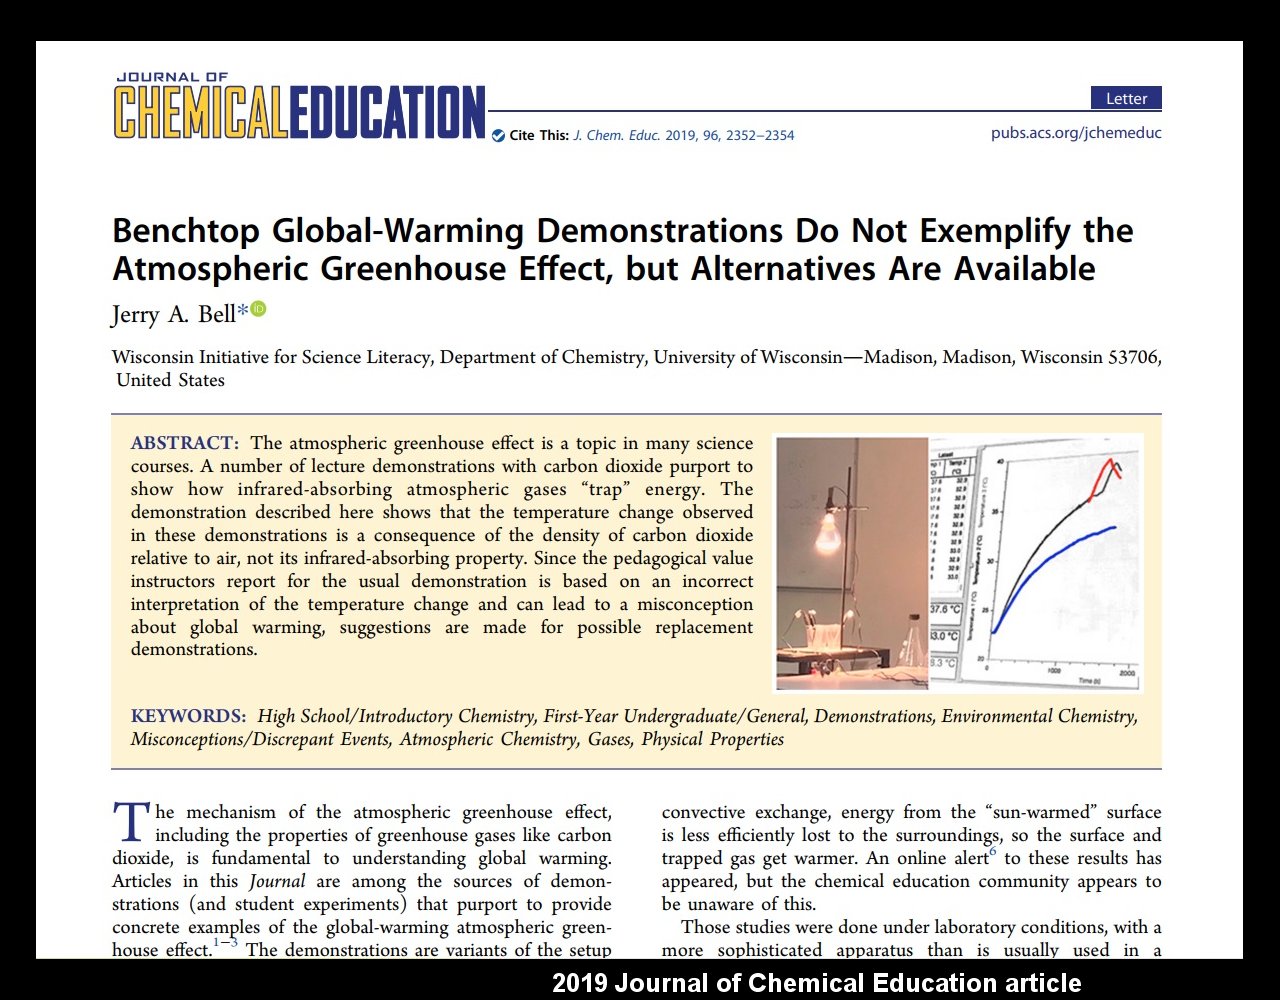
The title of that study should also make their point clear. Let me emphasize here that the demos that these studies criticize are actually the best available ones, for example the one use by Bill Nye, “the science guy”. A quick survey of other demos readily found on the Internet (refs 4-7) takes me to ones that are even less relevant to our atmosphere (sadly, even ones suggested by NASA). It is also unfortunate that even the above two studies use terms "climate change" and "global warming" in their titles, even though they are really about the greenhouse effect. These are distinct concepts, the former being about an increase in the latter. We are interested here only in the greenhouse effect.
As pictured in the first image above, all you need for this demo is a stove (or hotplate), a baking pan (if using the stove), oven mitts, new aluminum foil, a baking sheet (i.e., oven-safe paper), and a few teaspoons of vegetable oil. For extra safety, use protective eyewear. Total time needed once you have the pieces set out, is only about 15 minutes. No thermometer is needed because you can feel the warmth with your hand.
1) Set the baking pan on the stove burner, centered if possible.
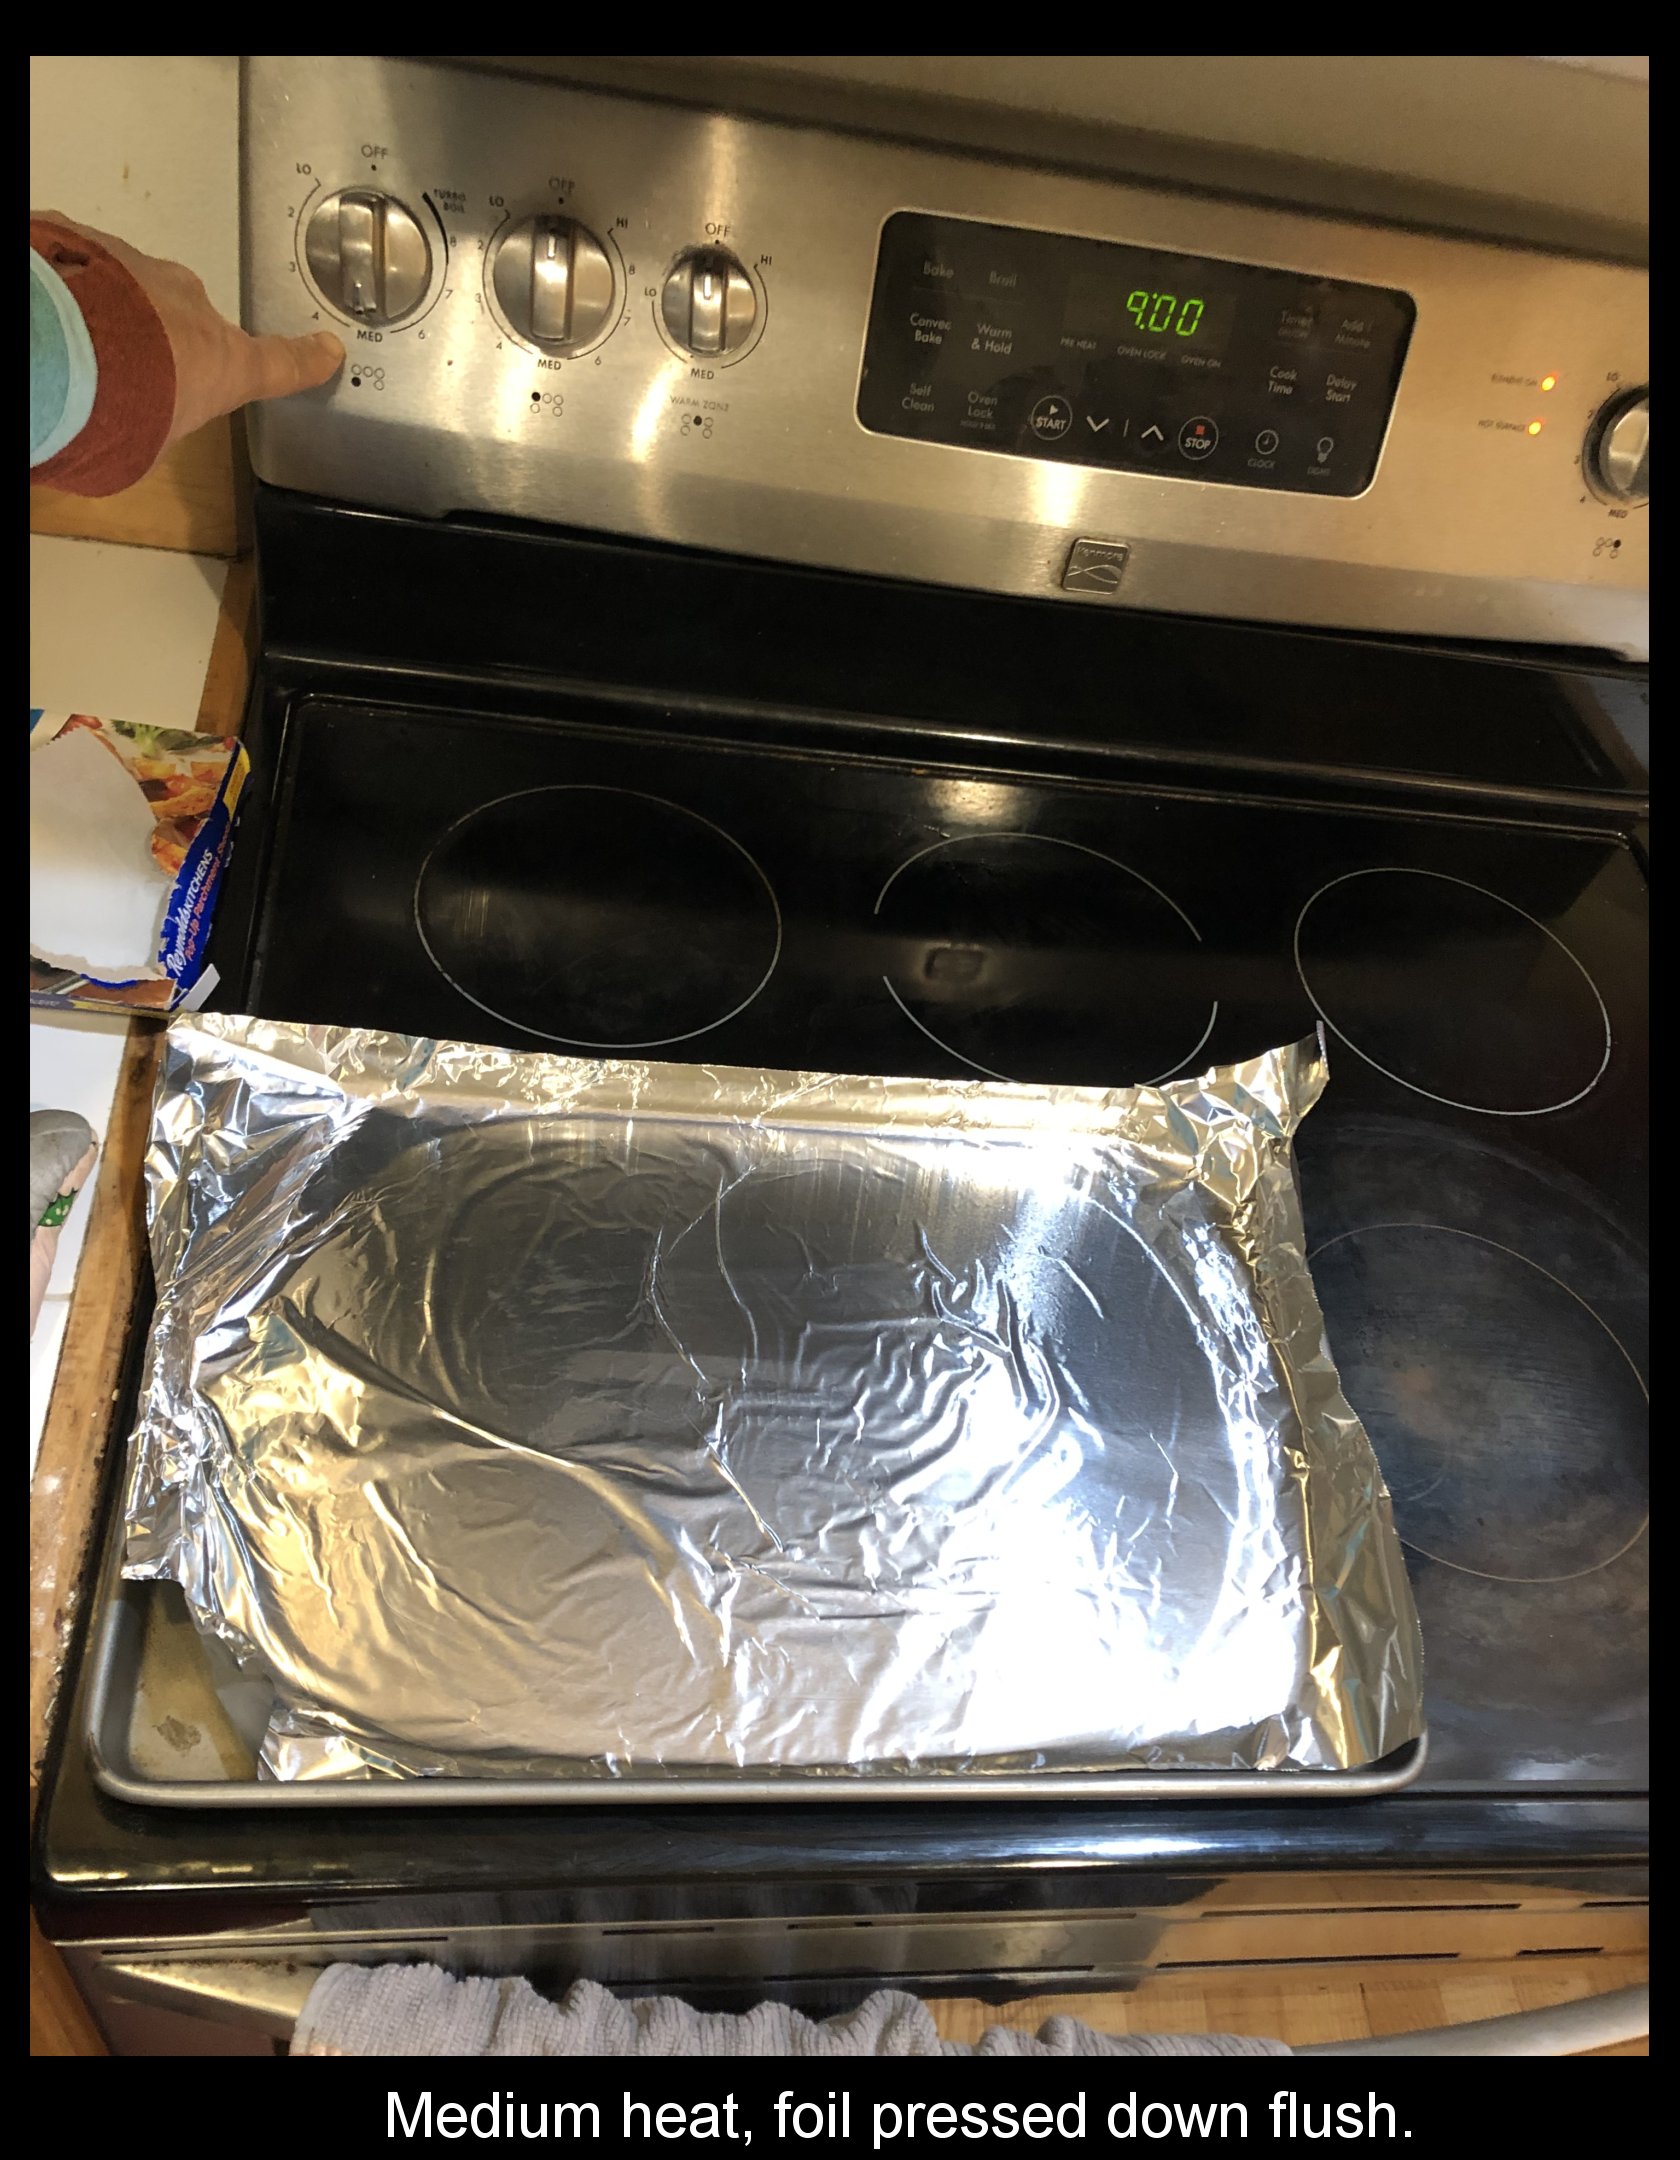
2) Put a little vegetable oil in the center and press on a section of aluminum foil to cover the base of the pan as completely as possible (can extend over the edges). Use an oven mitt to press the foil flush against the pan.
3) Turn the burner on to “medium” and wait about 10 minutes for it to heat up.
4) While waiting for the burner to warm up, tear off a piece of baking sheet large enough to nearly fill the area of the pan. Set it aside.
Once the pan has warmed up (carefully touch an edge of the pan to check), the experiment begins.
A) Put your hand a few inches above the center of the aluminum foil. Does it feel warm? WARNING: NEVER TOUCH THE FOIL SURFACE! IT IS VERY HOT!
B) Now put a little vegetable oil on the aluminum foil and carefully drop the baking sheet on the foil, trying to set it down without touching the hot surface so it covers nearly all of the foil. With the oven mitt on your hand, quickly press the baking sheet down so there are no air gaps between it and the foil (this is the purpose of the oil).
C) Now, repeat A). Does it feel noticeably warmer? (Before the baking sheet starts to burn, please use the mitts to move the pan off the burner and turn off the burner.)
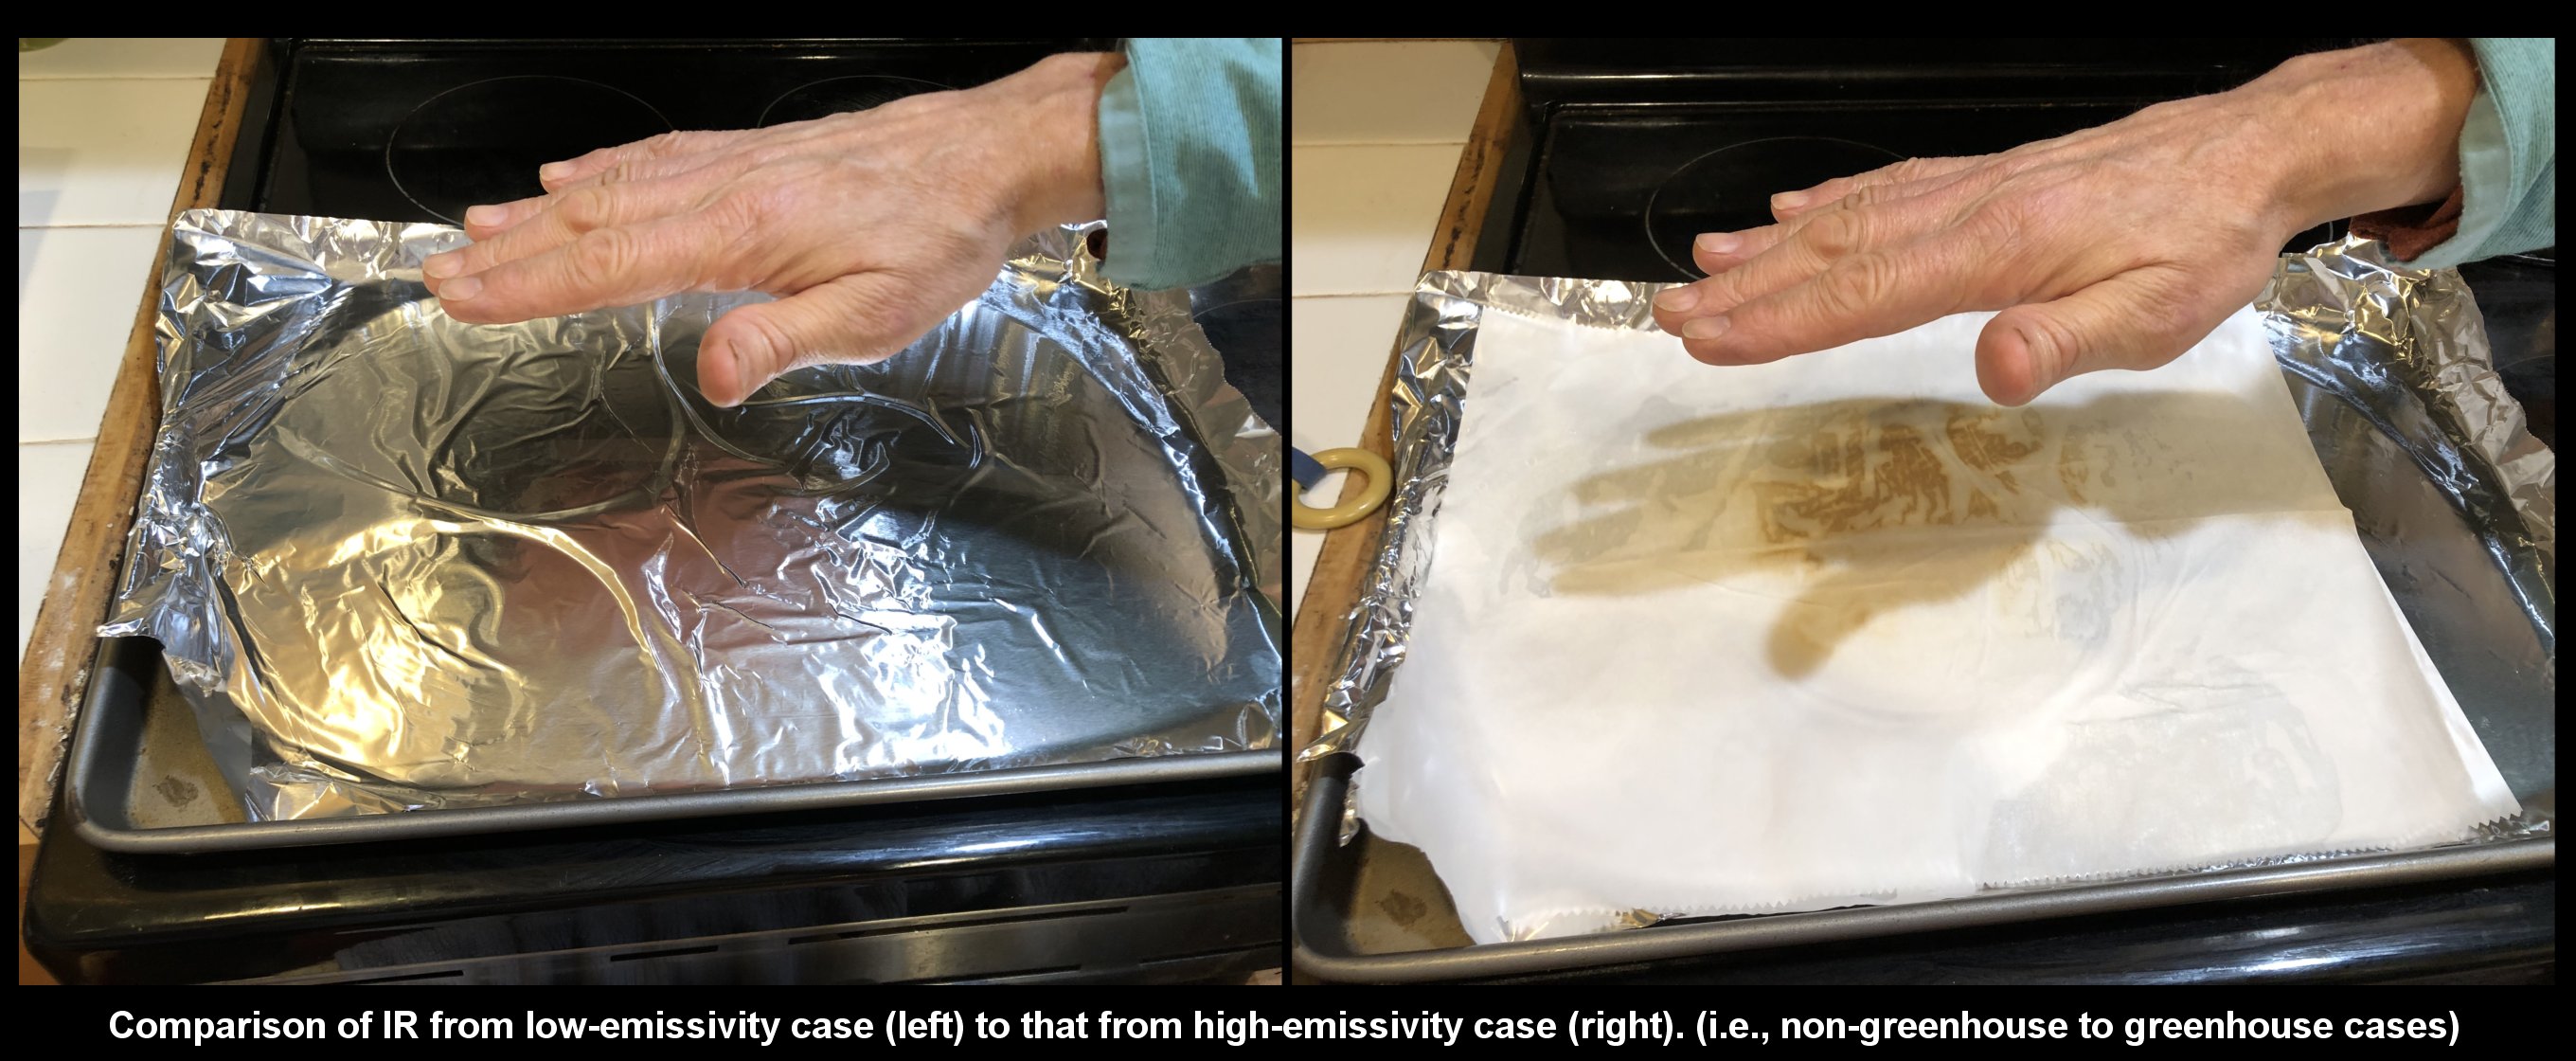
It seems weird that you can put a cool object (the baking sheet) between your hand and a hot surface to actually warm your hand. Nevertheless, your hand is warmer because the baking sheet is an effective radiator of IR, whereas the Al foil is a very poor radiator of IR. (This is why hot items are wrapped in foil to stay warm.) For this reason, the adding of Al foil to the pan likely made the pan even hotter--it reduced the capability of the pan to cool. With the oil between the pan and foil, and between the foil and baking sheet, all three were put in good thermal contact, exchanging heat via conduction and thus having essentially the same temperature. However, the the top layer (i.e., the foil in A, the baking sheet in C) cools by conducting to the air above, so the top surface will actually be slightly cooler than the pan. However, in general, the temperature of a hot object mostly cools by emitting IR, unless it is covered by a poor IR emitter like Al foil.
In this experiment, it is too easy to be fooled into thinking the foil is not hot because it does not feel hot a few inches away. However, if you touch it with bare finger, your finger will get a burn due to conduction.
The following sketch shows why adding a sheet on top is analogous to the adding of greenhouse gases or clouds to the atmosphere.
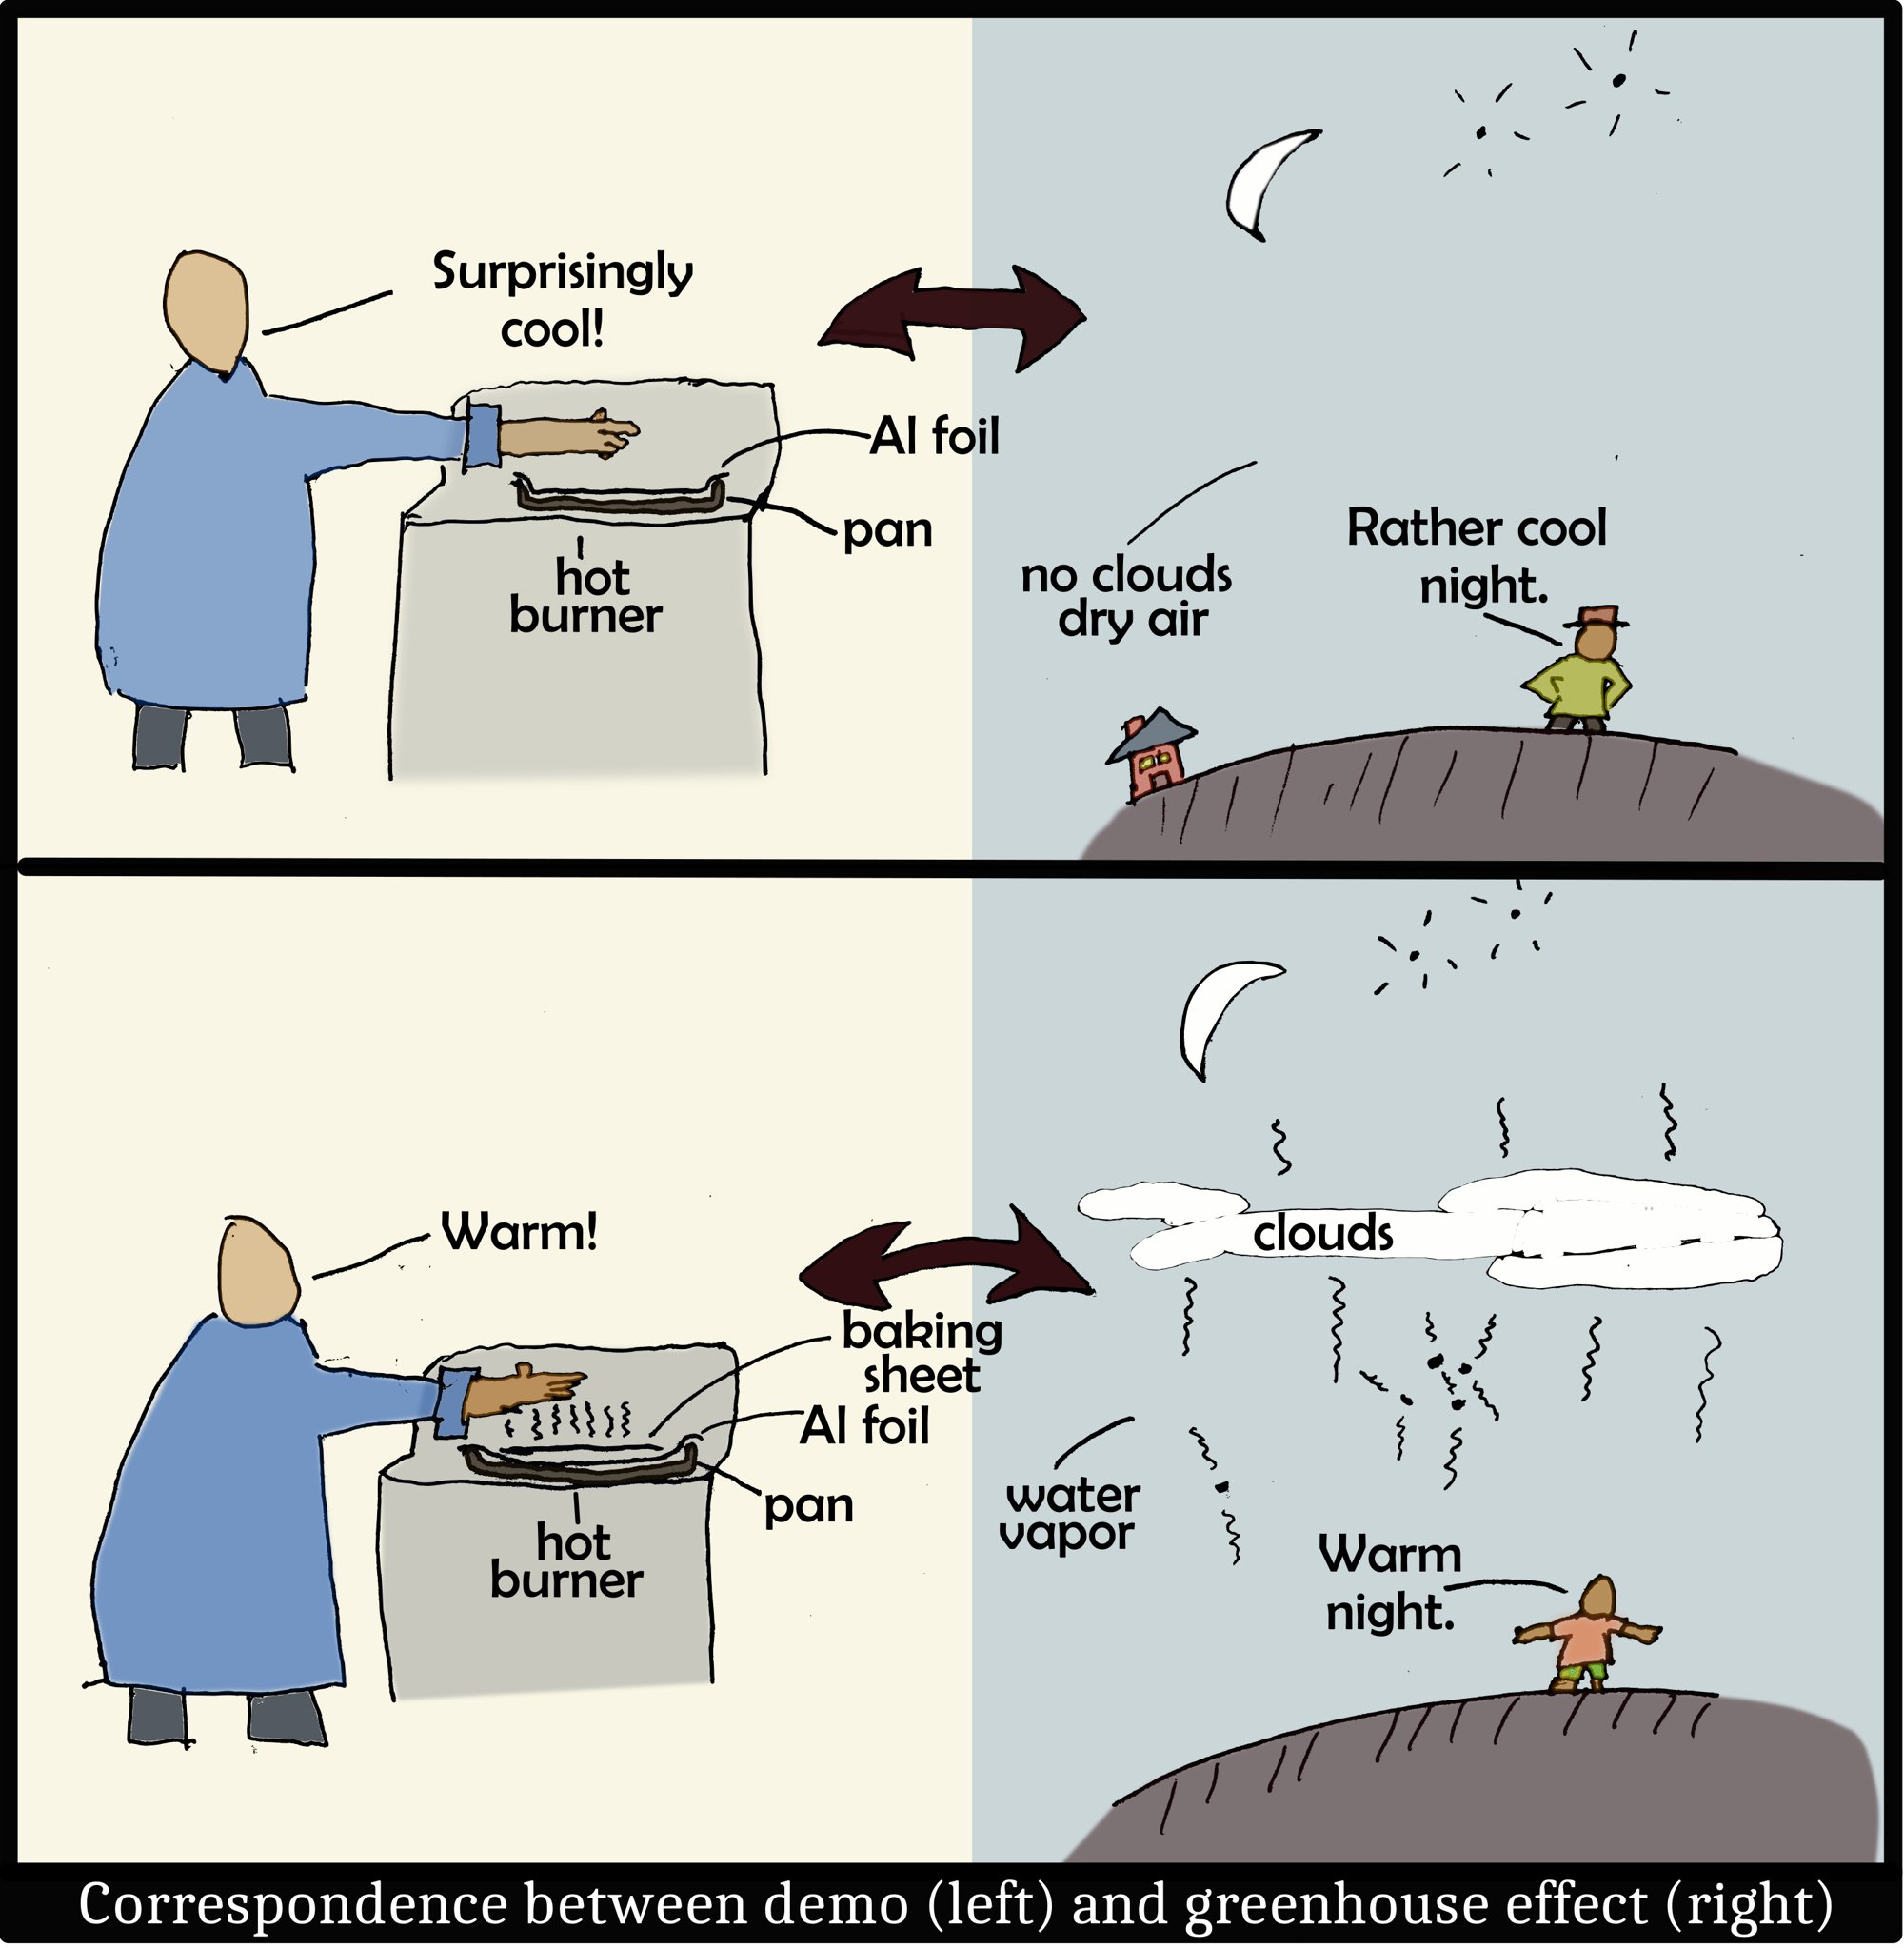
In brief, the baking sheet, like greenhouse gases (including water vapor) and clouds, are very effective at radiating IR. The air in the atmosphere may be warm, yet is not radiating until greenhouse gases or clouds are present. So, on clear, dry nights, we are cooler simply because there is very little above us that radiates IR down.
Curved Film Frost, Part 1: On the General Causes
March 15th, 2022As I've seen it, the three most common ways to depict coldness in art and culture are the snow crystal, the icicle, and the curving frost on windows.
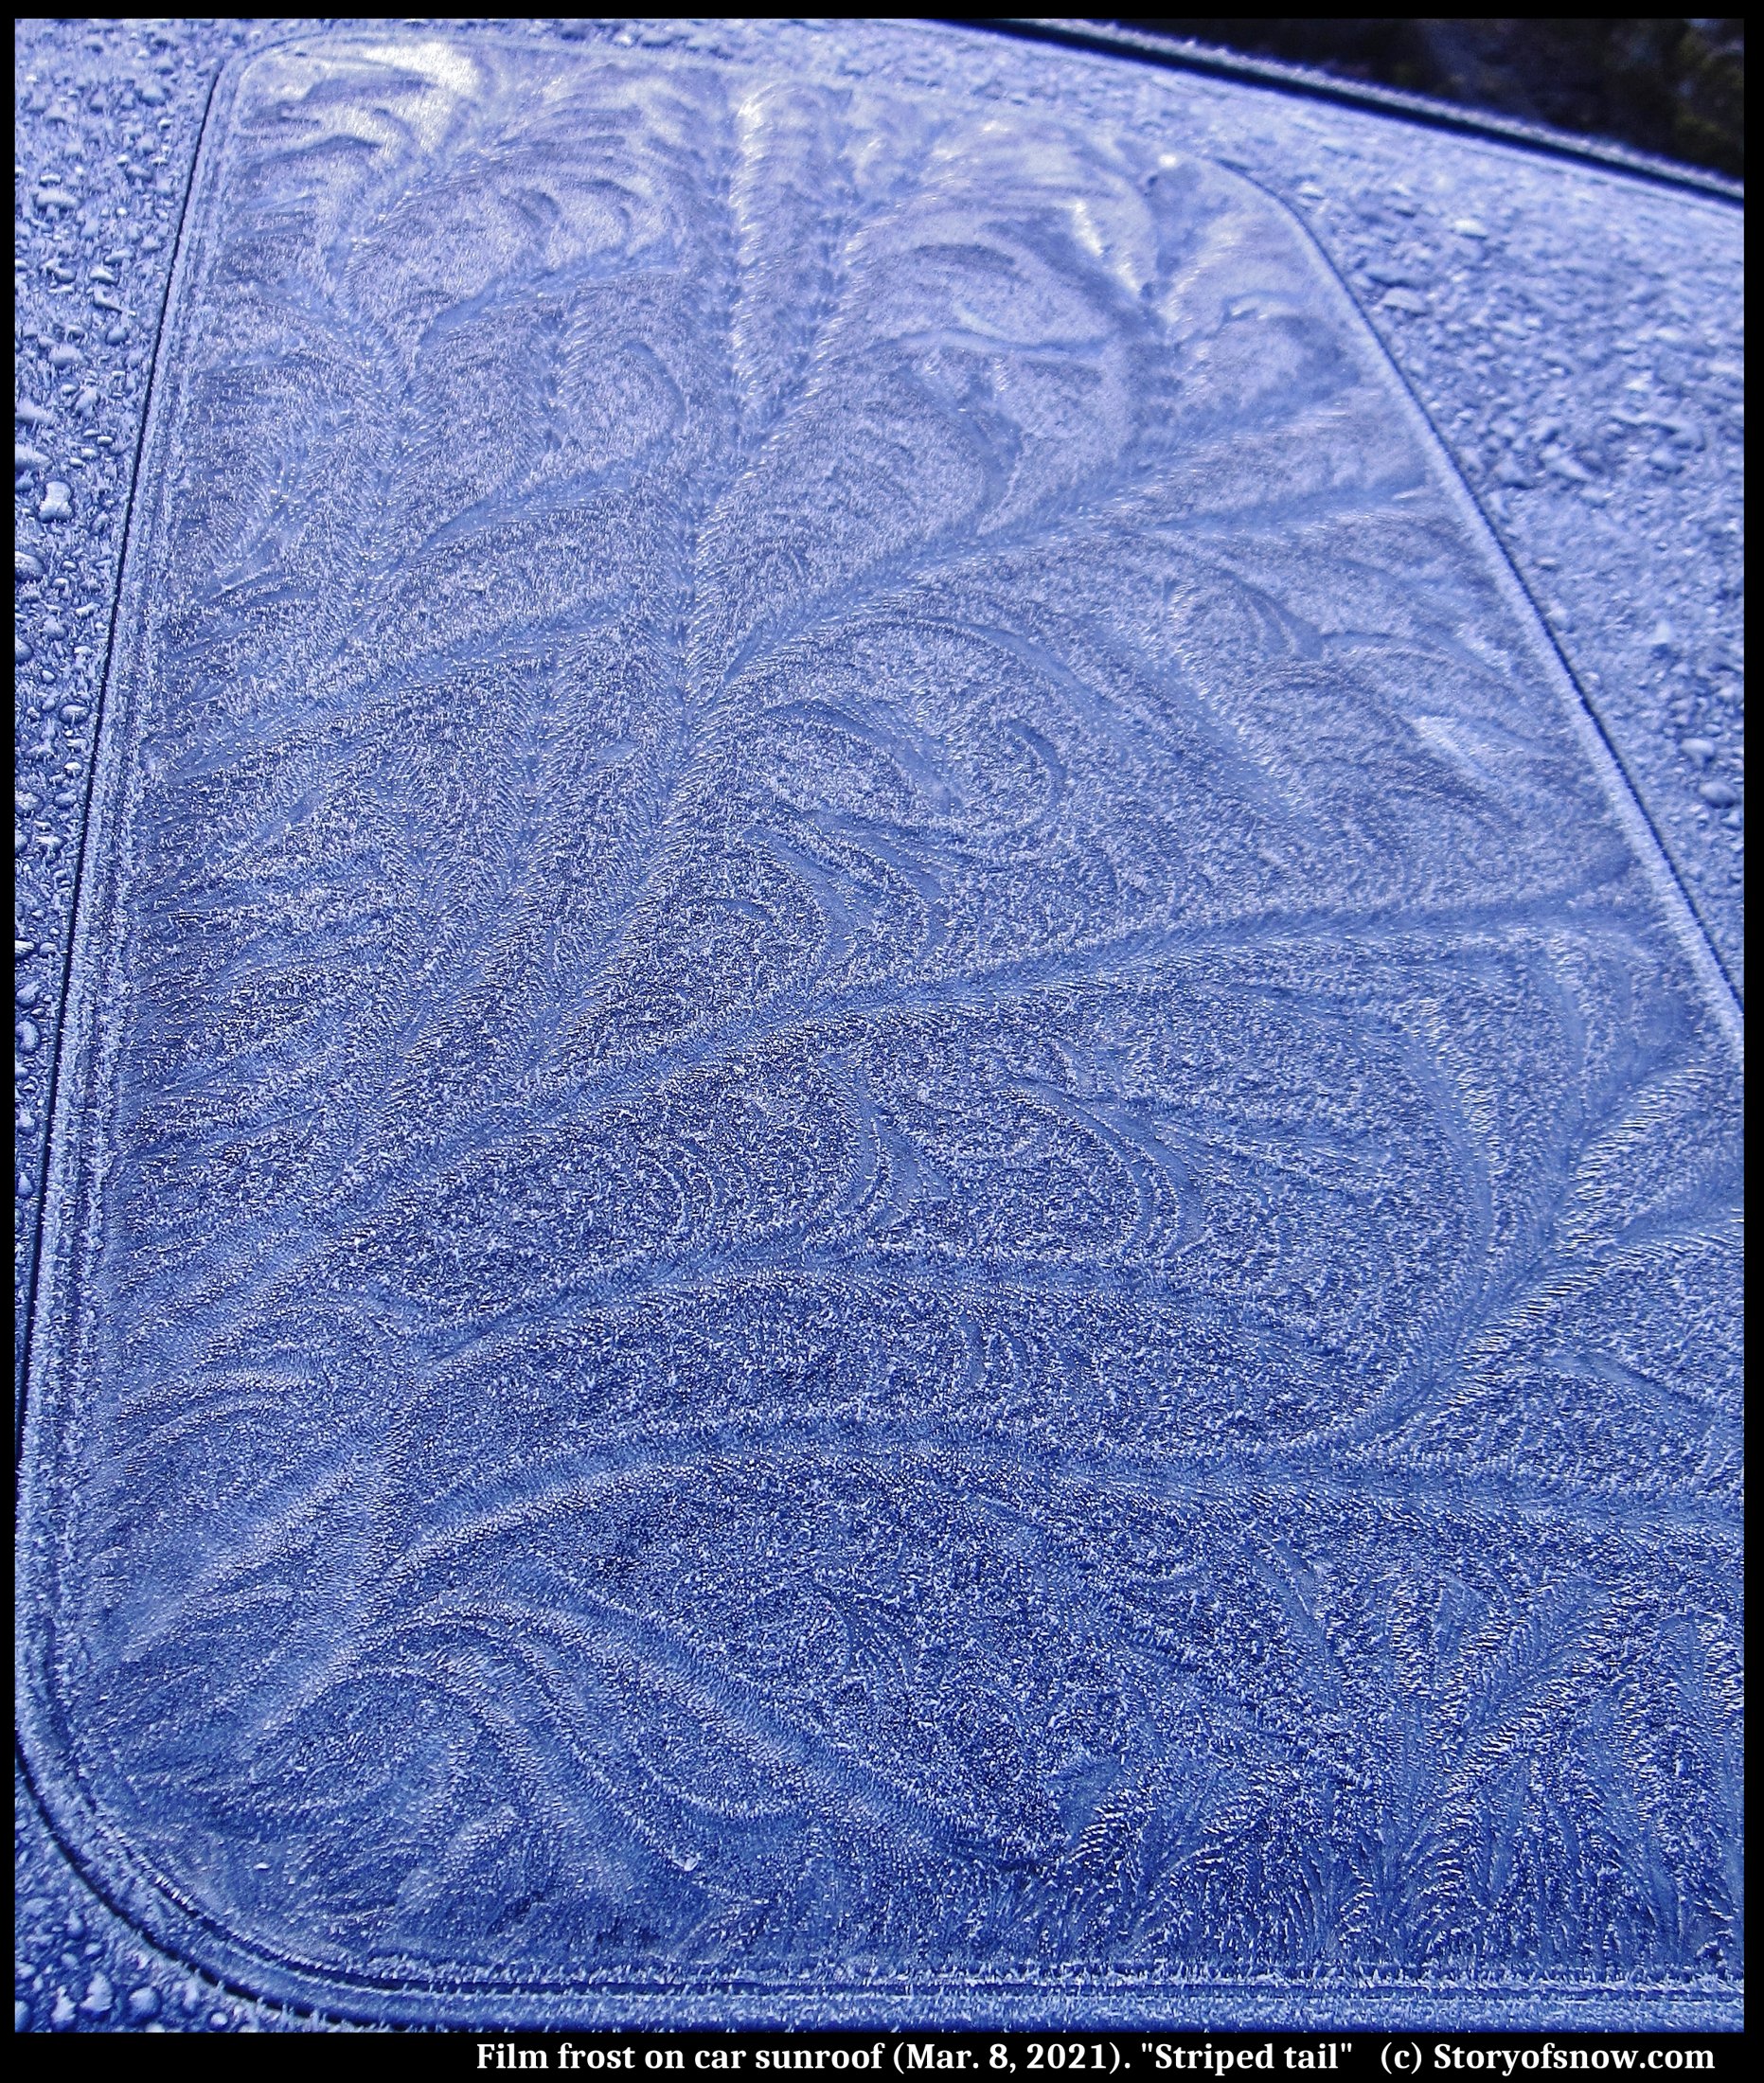
All of these have seen relatively little study, but without question the last has received the least. Indeed, I know of only three studies dedicated mainly to curving frost, and all three are over 50 years old.
It is perhaps little known that in terms of being observable to the typical observer, the third would likely be far more common. An odd thing to say? Well, people may say that they see it far less now due to the common use of central heating, or some might say that global warming is making it harder to form, but in these arguments they are wrong. I think the opposite: it is in fact far easier to see it now than maybe anytime in the past due to the ubiquitous presence of cars parked outdoors.
One curious thing about curved frost is its defining feature, the curviness. This feature contrasts with the straightness (and regularity) of snow crystals. What is the cause of the curviness in the former, as contrasts with the latter?
Avalanches, Part 2: Effect of Debris
March 5th, 2022In part 1 (1), motivated by an avalanche story, we saw that avalanching snow would hardly increase its temperature from all the tumbling. In fact, it would, in falling down some elevation X, warm up by an amount that would be about half of that of the increase in local air temperature at the lower elevation. So, in a sense, you might even argue that the avalanching snow has cooled relative to the surroundings. Even more surprising, you might think, is that even if the snow had been at the melting temperature before avalanching down, only a tiny fraction of it would melt, even if falling down 1000 m.
However, going back to a story about the debris-filled avalanche in the Himalaya, consider now a boulder tumbling down a mountain. It hits some snow and comes to rest. As with the tumbling snow case, the energy the boulder had above will transform to heat energy when it comes to rest. How much snow will melt?
A maximum possible amount can easily be estimated by assuming that the tumbling does not slow the boulder, the boulder itself does not heat up, and the snow is already at the melting point. The amount of melt will be in proportion to the size of the boulder, so we look at the fractional volume of snow that melts (volume of snow divided by volume of the boulder):
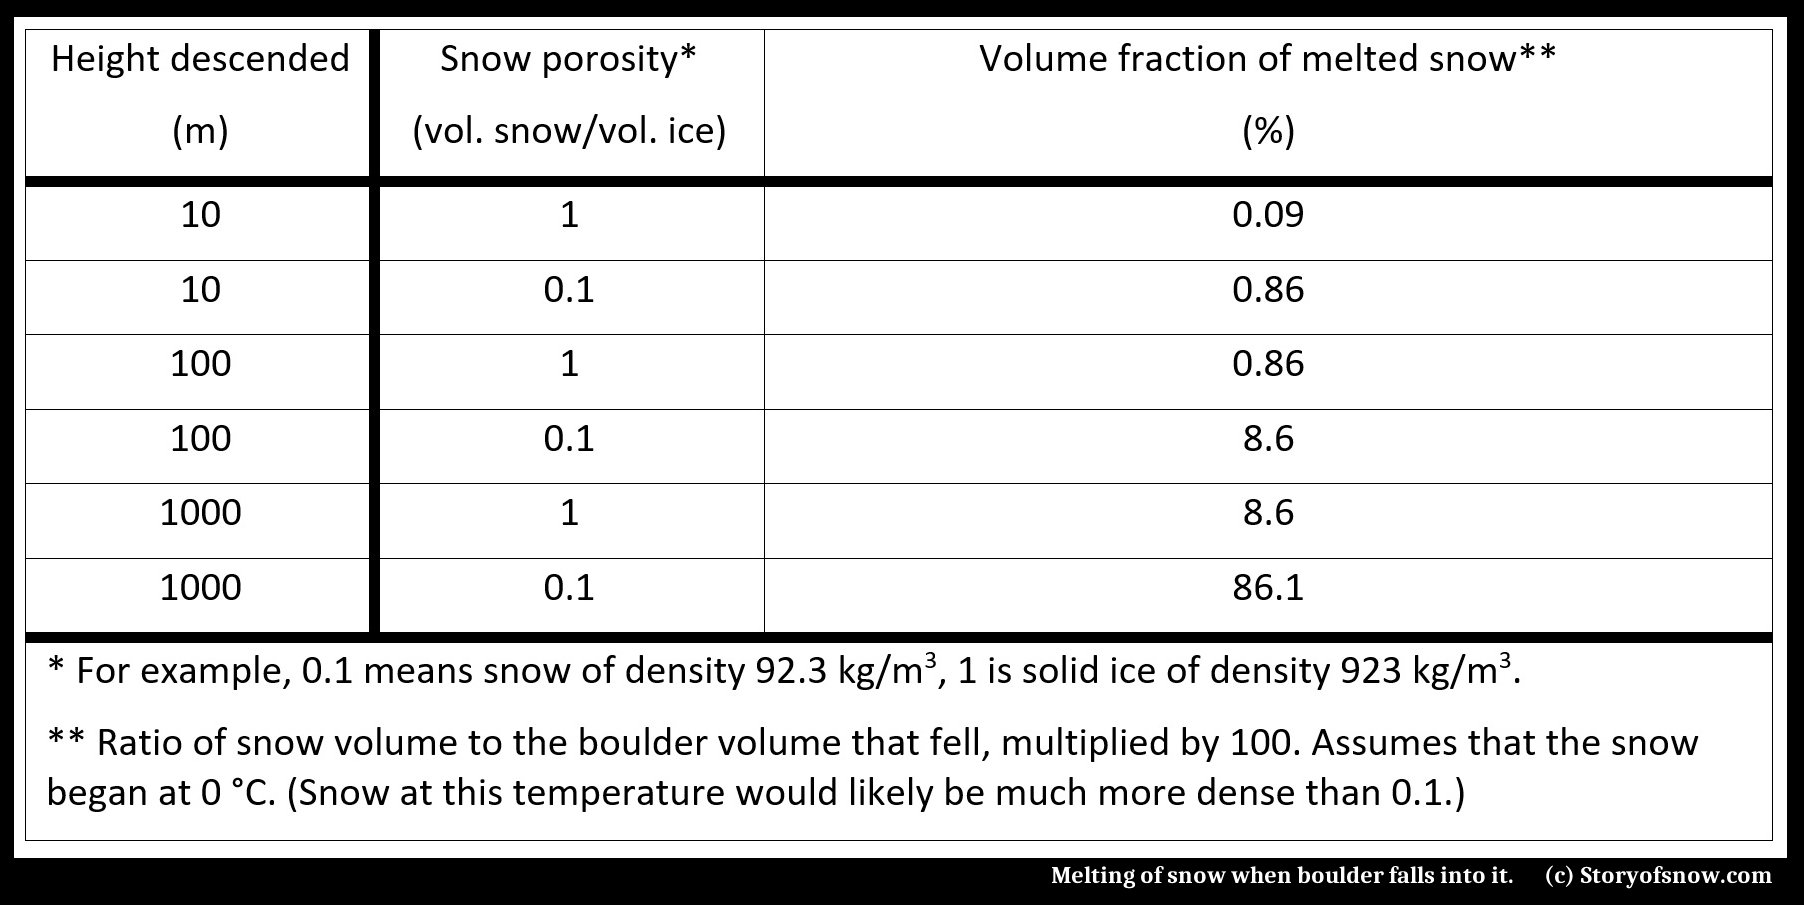
As you can see from the table, the boulder is more effective at melting the snow than just the tumbling snow case considered in (1). This result seems reasonable given that a boulder is denser than ice and thus has more potential energy. Even so, relatively little ice will melt.
The reason for the latter is the large amount of energy needed to melt ice. For example, to melt a chunk of ice that sits right at the melting temperature equals the amount of energy needed to warm the ice from a much cooler temperature to the melting point.
How much cooler, you might ask?
Well, about 285 degrees Fahrenheit (159 degrees C). So, if you are out in the winter and need to melt some snow at -20 C, and you've used half your stove's gas just to get it to -1 C, you might think that you are nearly there. But in fact you will need to get a lot more gas for your stove before you can even think about melting all of it.
--JN
References and notes
1. Avalanches, Part 1: Snow Hardening
https://www.storyofsnow.com/blog1.php/avalanches-part-1-snow-hardening
Frozen Drops on Web
March 4th, 2022They condense from the vapor, get jiggled and jostled, coalesce, and then suddenly, they freeze.
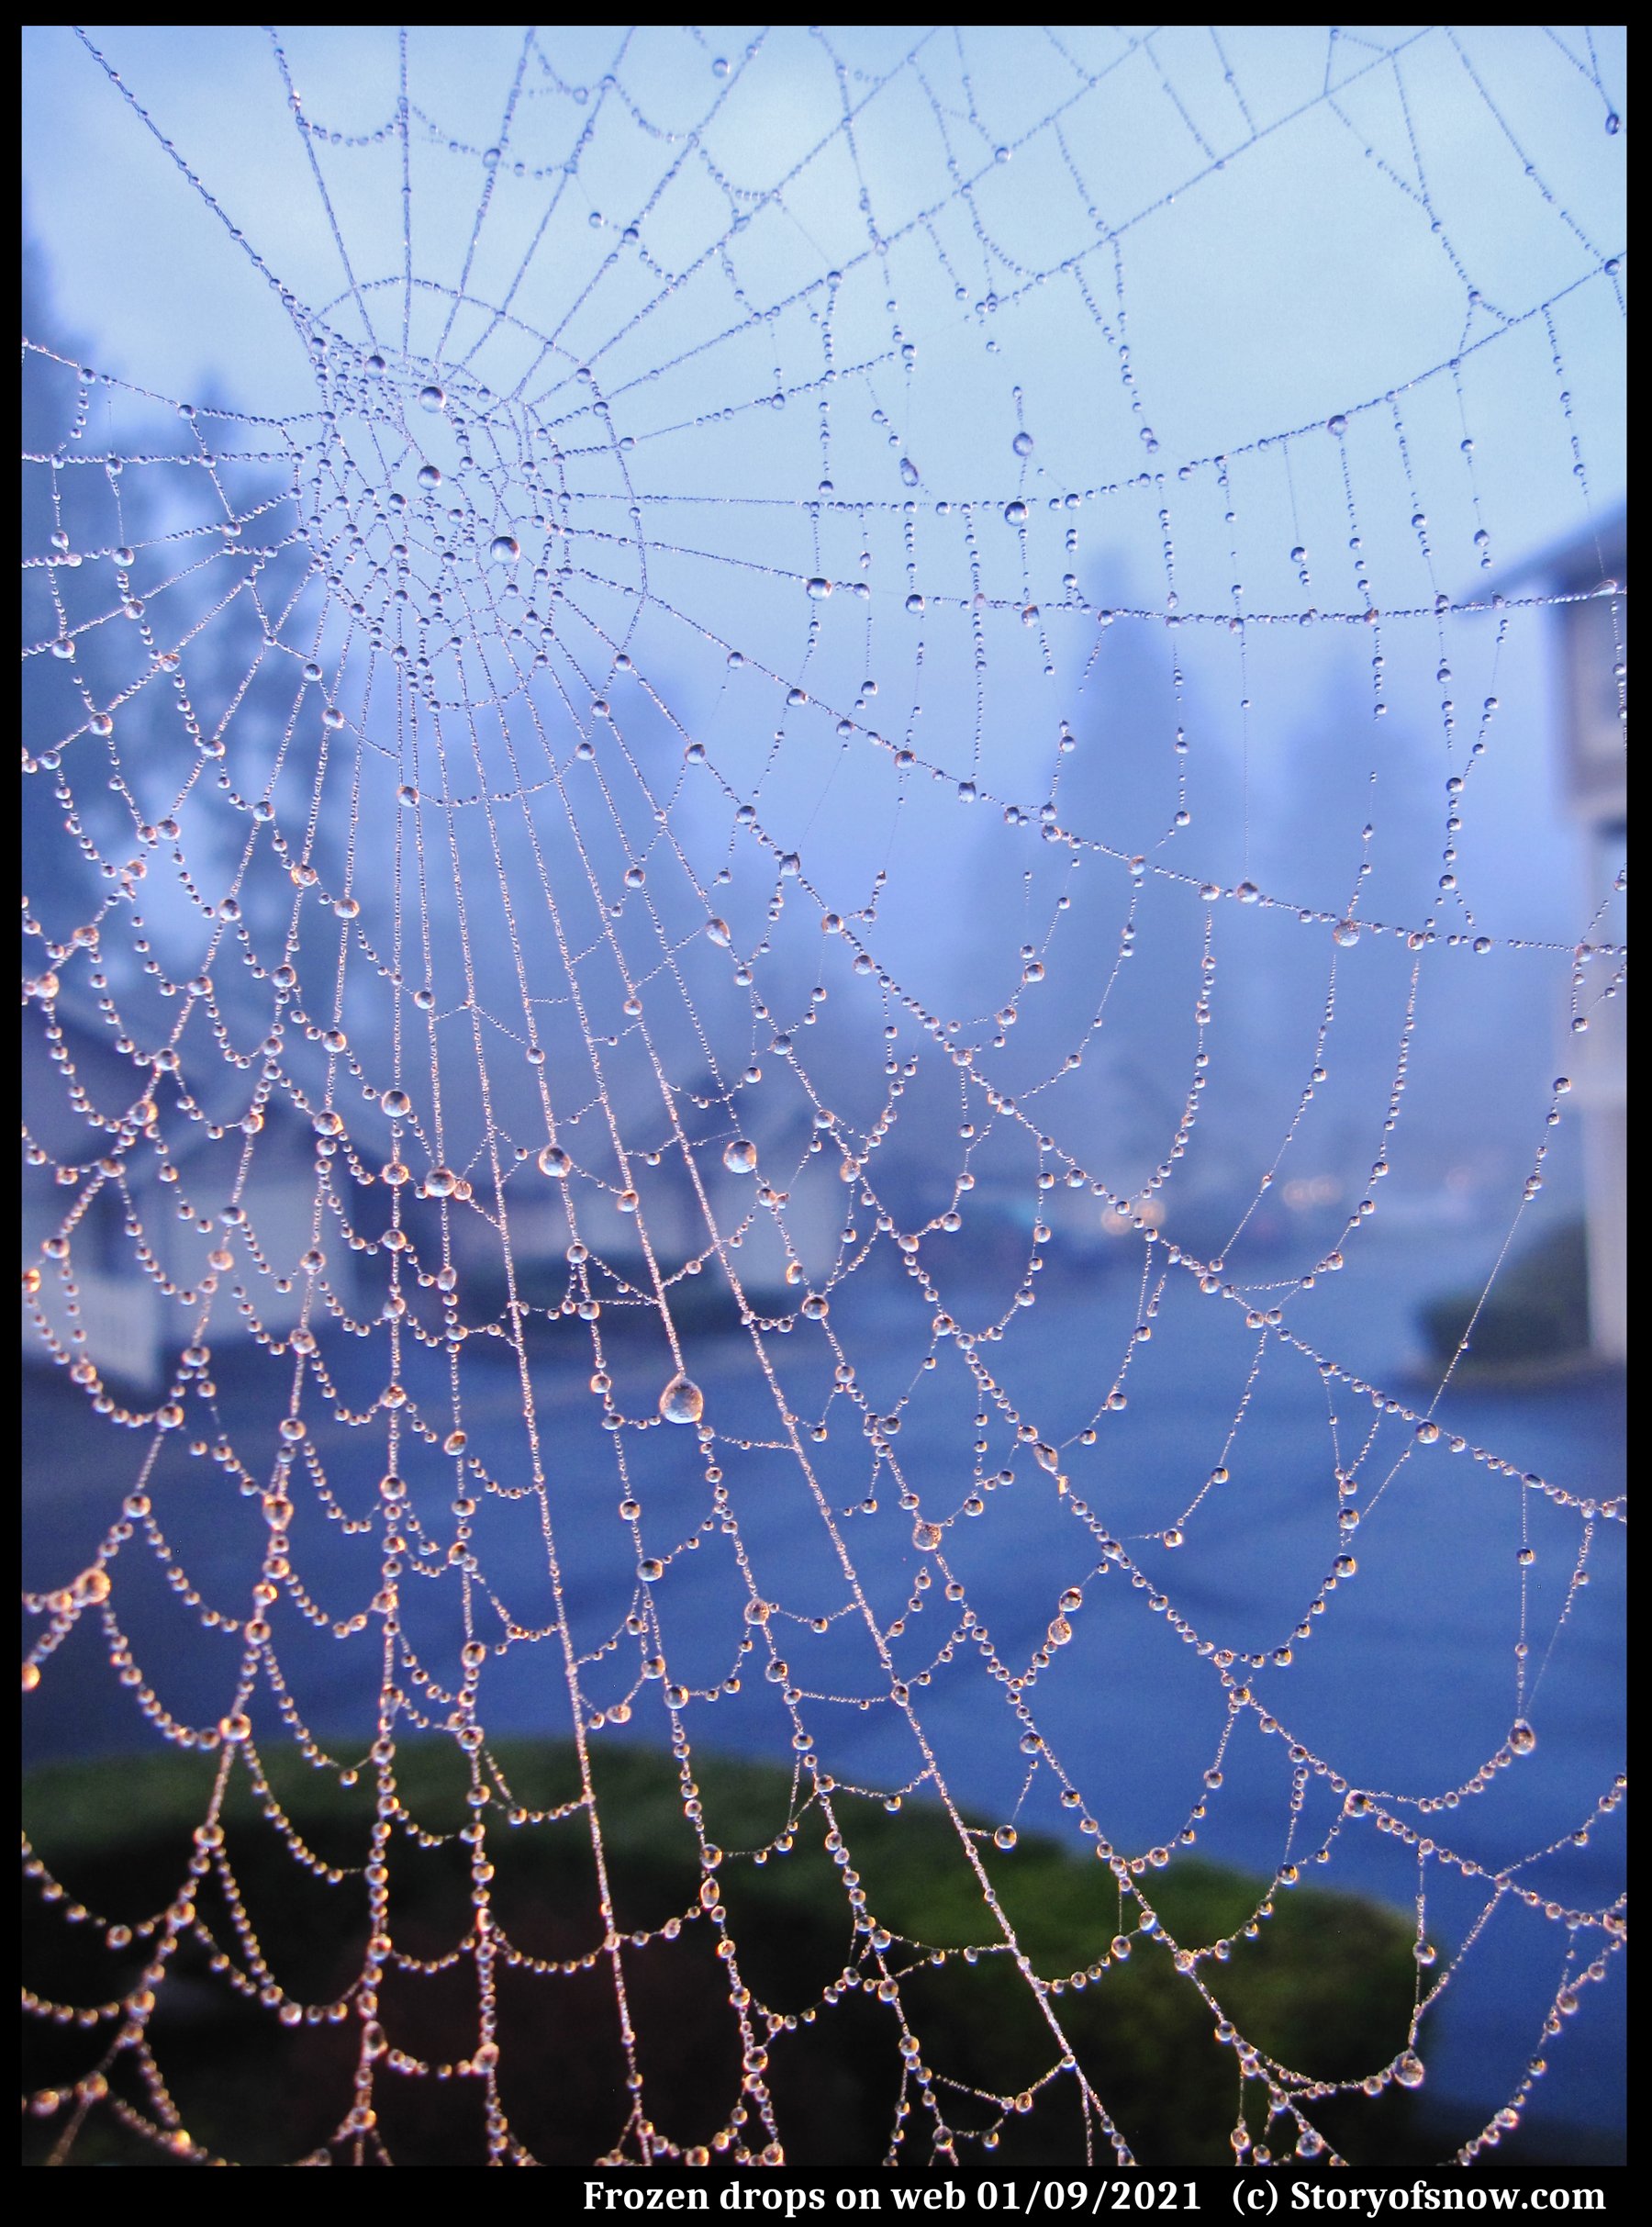
You can see a few strands, more nearly vertical, that must have had a drop slide down soon before freezing, sweeping out all the other droplets and leaving only a thread of densely packed tiny drops.
The freezing, one started, likely spreads along a thin film on the web from drop to drop, freezing all drops. The largest drops tend to be at thread intersections that tended to keep them from moving further. Other droplets may have slid along, only to collide and coalesce with the one fixed to several threads.
The spider made mostly four-sided polygons, though in the center of the web, you find more variety. Some triangles, some pentagonal, some hexagonal.
In the atmosphere, we call just-frozen droplets, having only enough vapor growth to imagine facets, as droxtals. Perhaps some of the smallest ones here could be droxtals.
--JN
Bentley’s Most Singular Observation
March 2nd, 2022[This is the seventh and last in the series of re-posted articles, from 2012.]
You don’t have to look at frosted surfaces for very long before coming across something like the following.
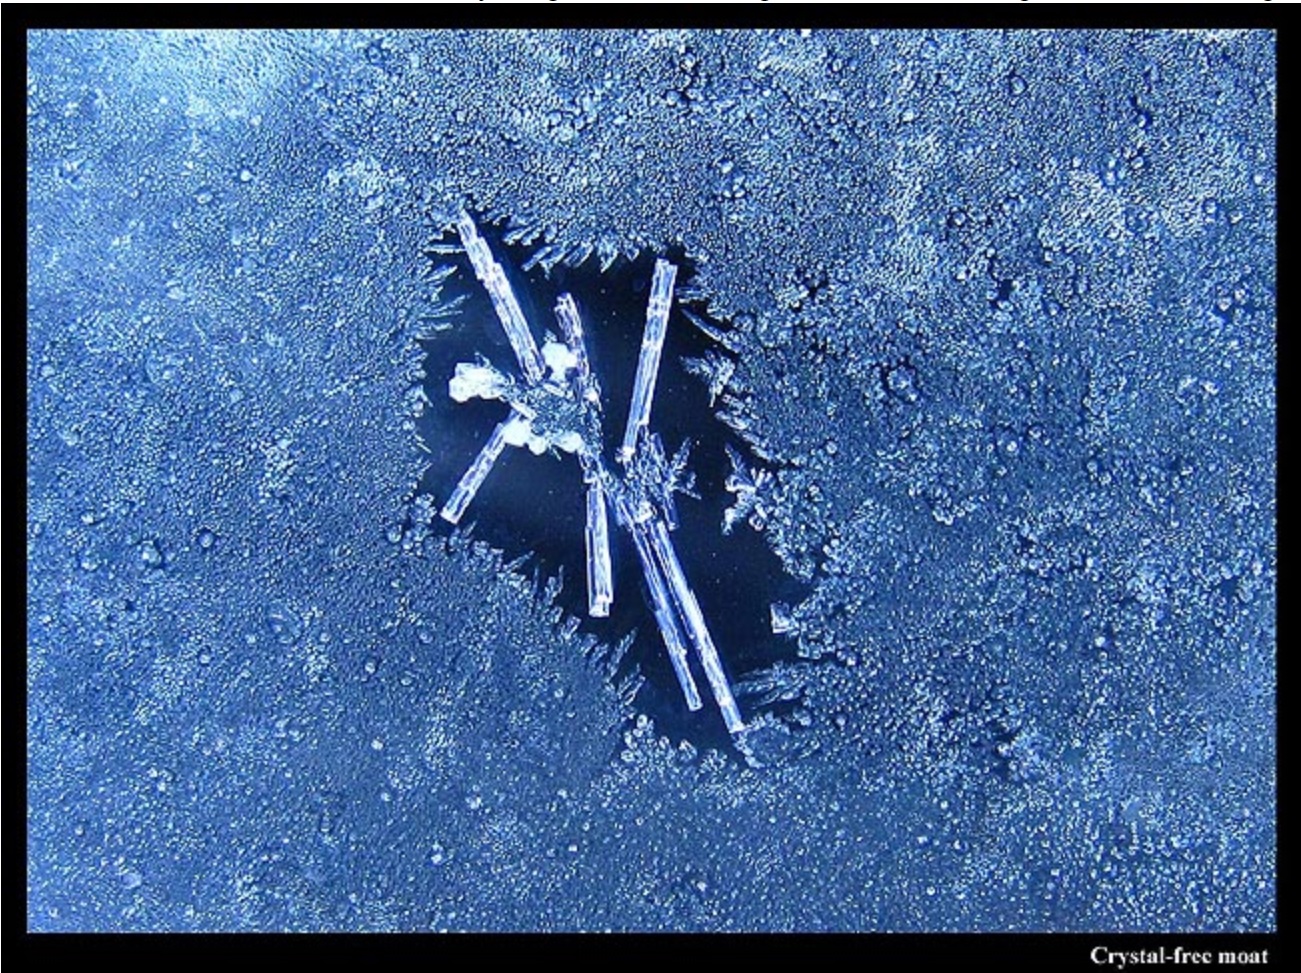
The picture shows a large ice crystal amid a roughly uniform sea of tiny frozen droplets. Between the large crystal and the frozen droplets lies a clear ice-free zone, a dry moat around an island of ice. Sometime prior to 1907, the Vermont farmer Wilson A. Bentley took notice of this moat. Writing in the Monthly Weather Review in 1907, he wrote
"One of the most singular, and doubtless most important, phenomena that occur in connection with the formation of window frost is this: The true crystalline varieties of window frost ordinarily, apparently, repel the minute liquid particles or droplets of water that frequently collect like tiny dew-drops on the glass, and freeze in granular form thereon."
Why six?
March 2nd, 2022[This is the sixth in the series of re-posted articles, from 2011.]
Why do so many snow crystals look about the same when rotated by 1/6 of a turn? What’s the origin of the six-fold symmetry? Why not five or seven, as Kepler asked(1)?
Since it always happens, when it begins to snow, that the first particles of snow adopt the shape of small, six-cornered stars, there must be a particular cause; for if it happened by chance, why would they always fall with six corners, and not with five, or seven, as long as they are still scattered and distinct, and before they are driven into a confused mass?
Though we can now answer the last two questions, the first, as pondered by Bentley and many others, still awaits a complete answer.
The thing that allows (but does NOT cause) the crystal to have six-fold symmetry comes down to in its internal crystalline lattice of water molecules. Specifically, if you could zoom in about a million times into any region of a snow crystal, such as the corner in figure 1A below, you would see a lattice of hexagonal rings B) – like a microscopic internal honeycomb. The oxygen atoms (black) in each ring have the six-fold symmetry. But if you further examine the rings, notice that all of them are rotated by 30º in relation to the crystal hexagon in A).
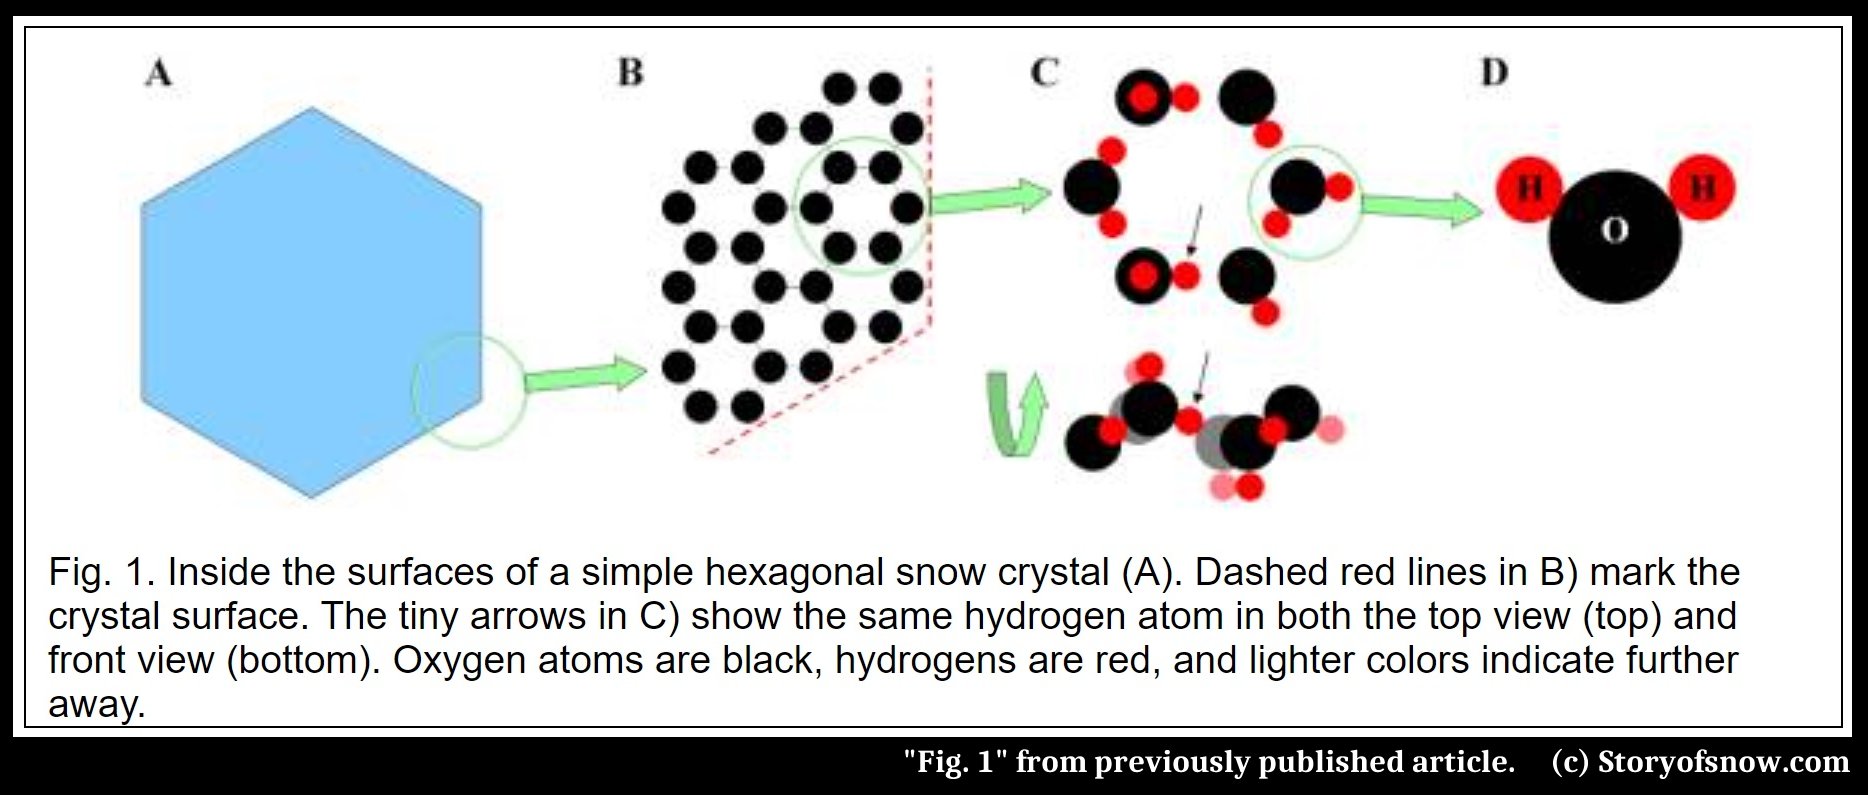
However, if you look even closer, such that you can see the orientations of the molecules, and turn the ring on its side, as in C), you will see that in fact the ring is not perfectly six-fold symmetric and it’s not even flat! The honeycomb inside ice is not so simple. But if you sought the overly simplified answer to the origin of the “6”, find it in the hexagonal lattice. Call that the answer for the easily persuaded. There are serious problems though with that answer.
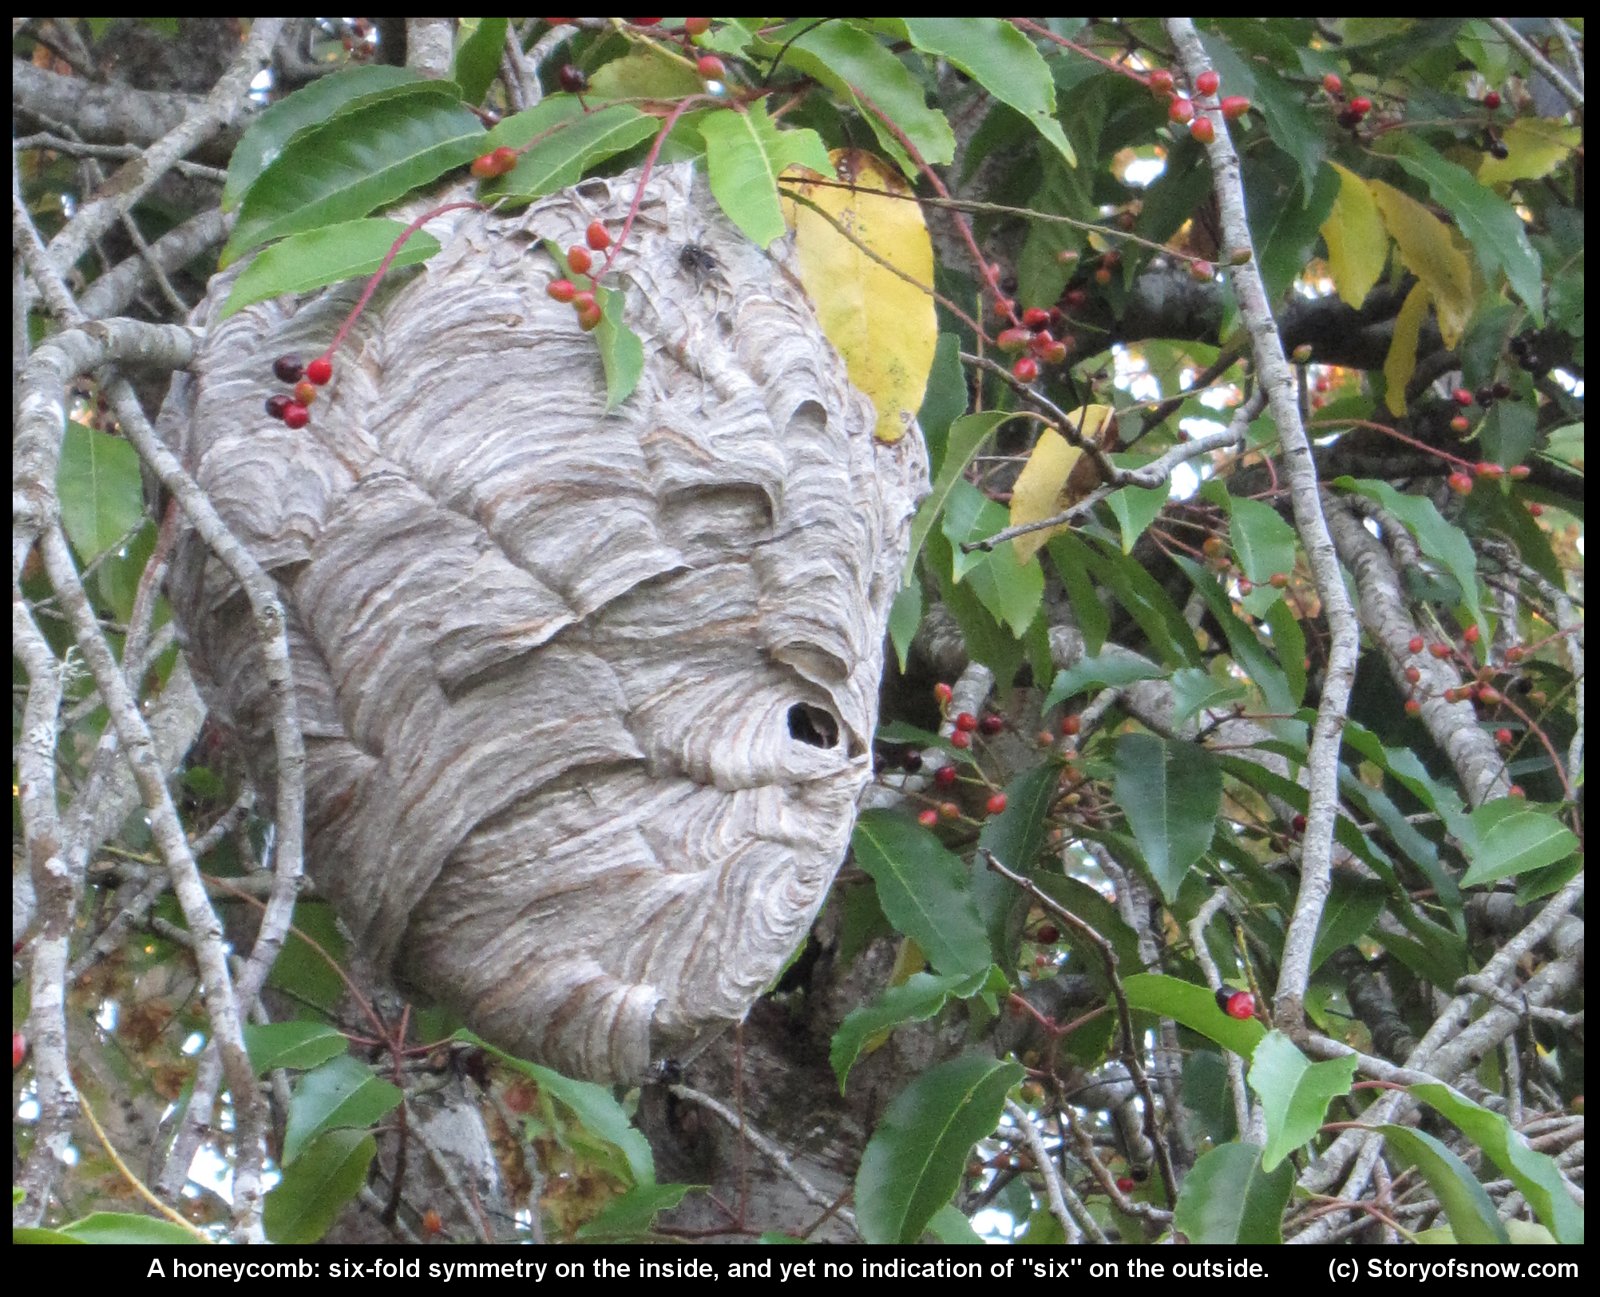
The simple answer specifically has two problems. The internal honeycomb just gives us a similarity between the ice lattice and the crystal form – it suggests that the crystal may develop six-fold symmetry. But just because a crystal may have six sides doesn’t mean it will have six sides. Or, to use one of Kepler’s examples, a beehive also has an internal honeycomb structure, and yet from the outside it appears blobby and nondescript – hardly six-sided.
Blues and Whites of Snow and Ice
March 1st, 2022A recent article in the local newspaper asks the question "Why does snow glow blue?"
The author gave one inspiration for the article as "..the way white snow glows turquoise in the holes left by boots or ski poles..."
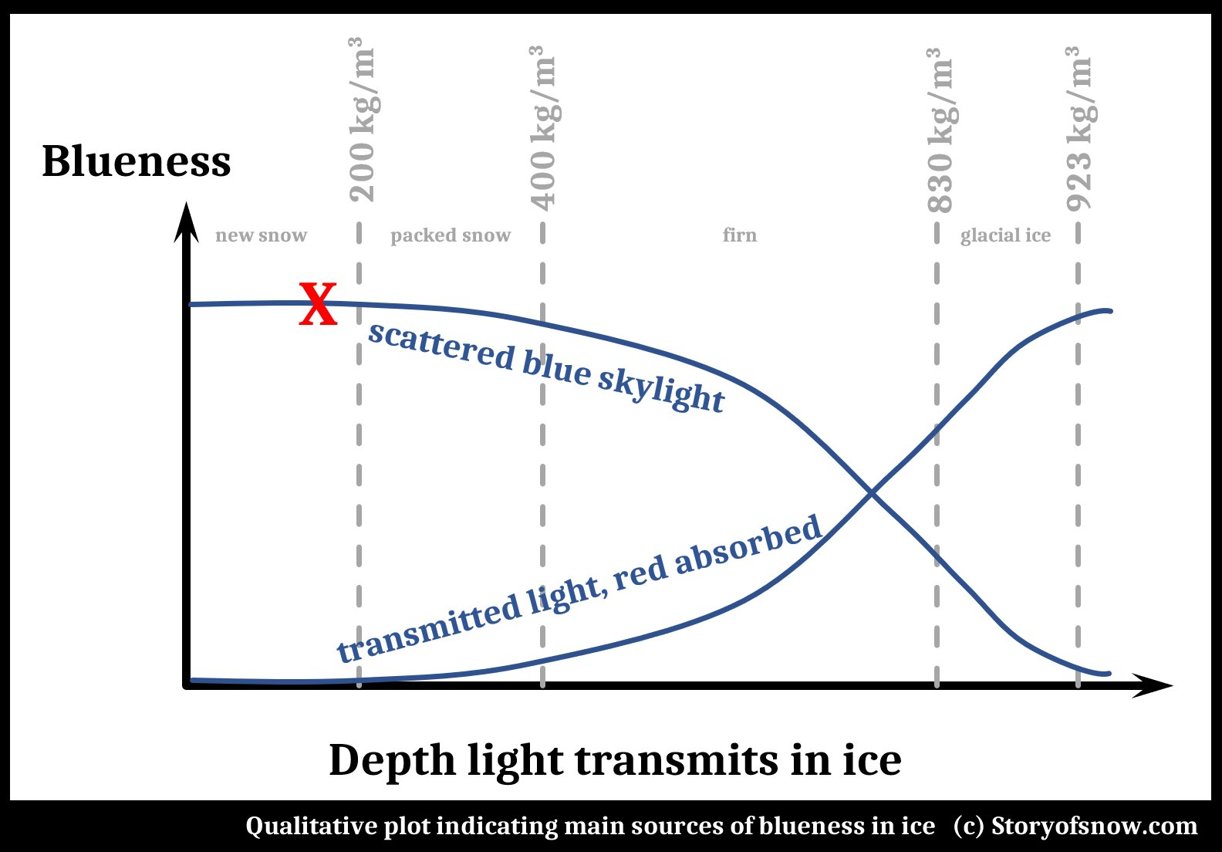
The explanation given in the article is the same as that you can find elsewhere on the internet, and certainly applies to glacial ice: absorption of the red end of the solar spectrum upon passing through ice. Does it indeed apply to "holes left by boots or ski poles" in snow?
(The answer is "Not in fresh, light snow, though possible in more compressed or wetter snow." And for some quirk of this blog software, I cannot put the following plot in its proper location further down, so I place it here. Please ignore it for now and refer to it at the end of this post.)
Avalanches, Part 1: Snow Hardening
February 25th, 2022Why does snow seem to harden after an avalanche?
Those unfortunate few who have been buried in an avalanche often observe the snow, once stopped, has hardened. Some liken it to concrete. Whereas the powder before the avalanche seemed light and easy to move, once buried, the victim finds it impossible to move.
I have never had that experience, though I find the observation reasonable. For example, on a recent hike up a snow-covered hillside, I used snowshoes to avoid "postholing" through the snow. But when I came to a region where snow had slid down, I removed the snowshoes and easily walked on the surface.
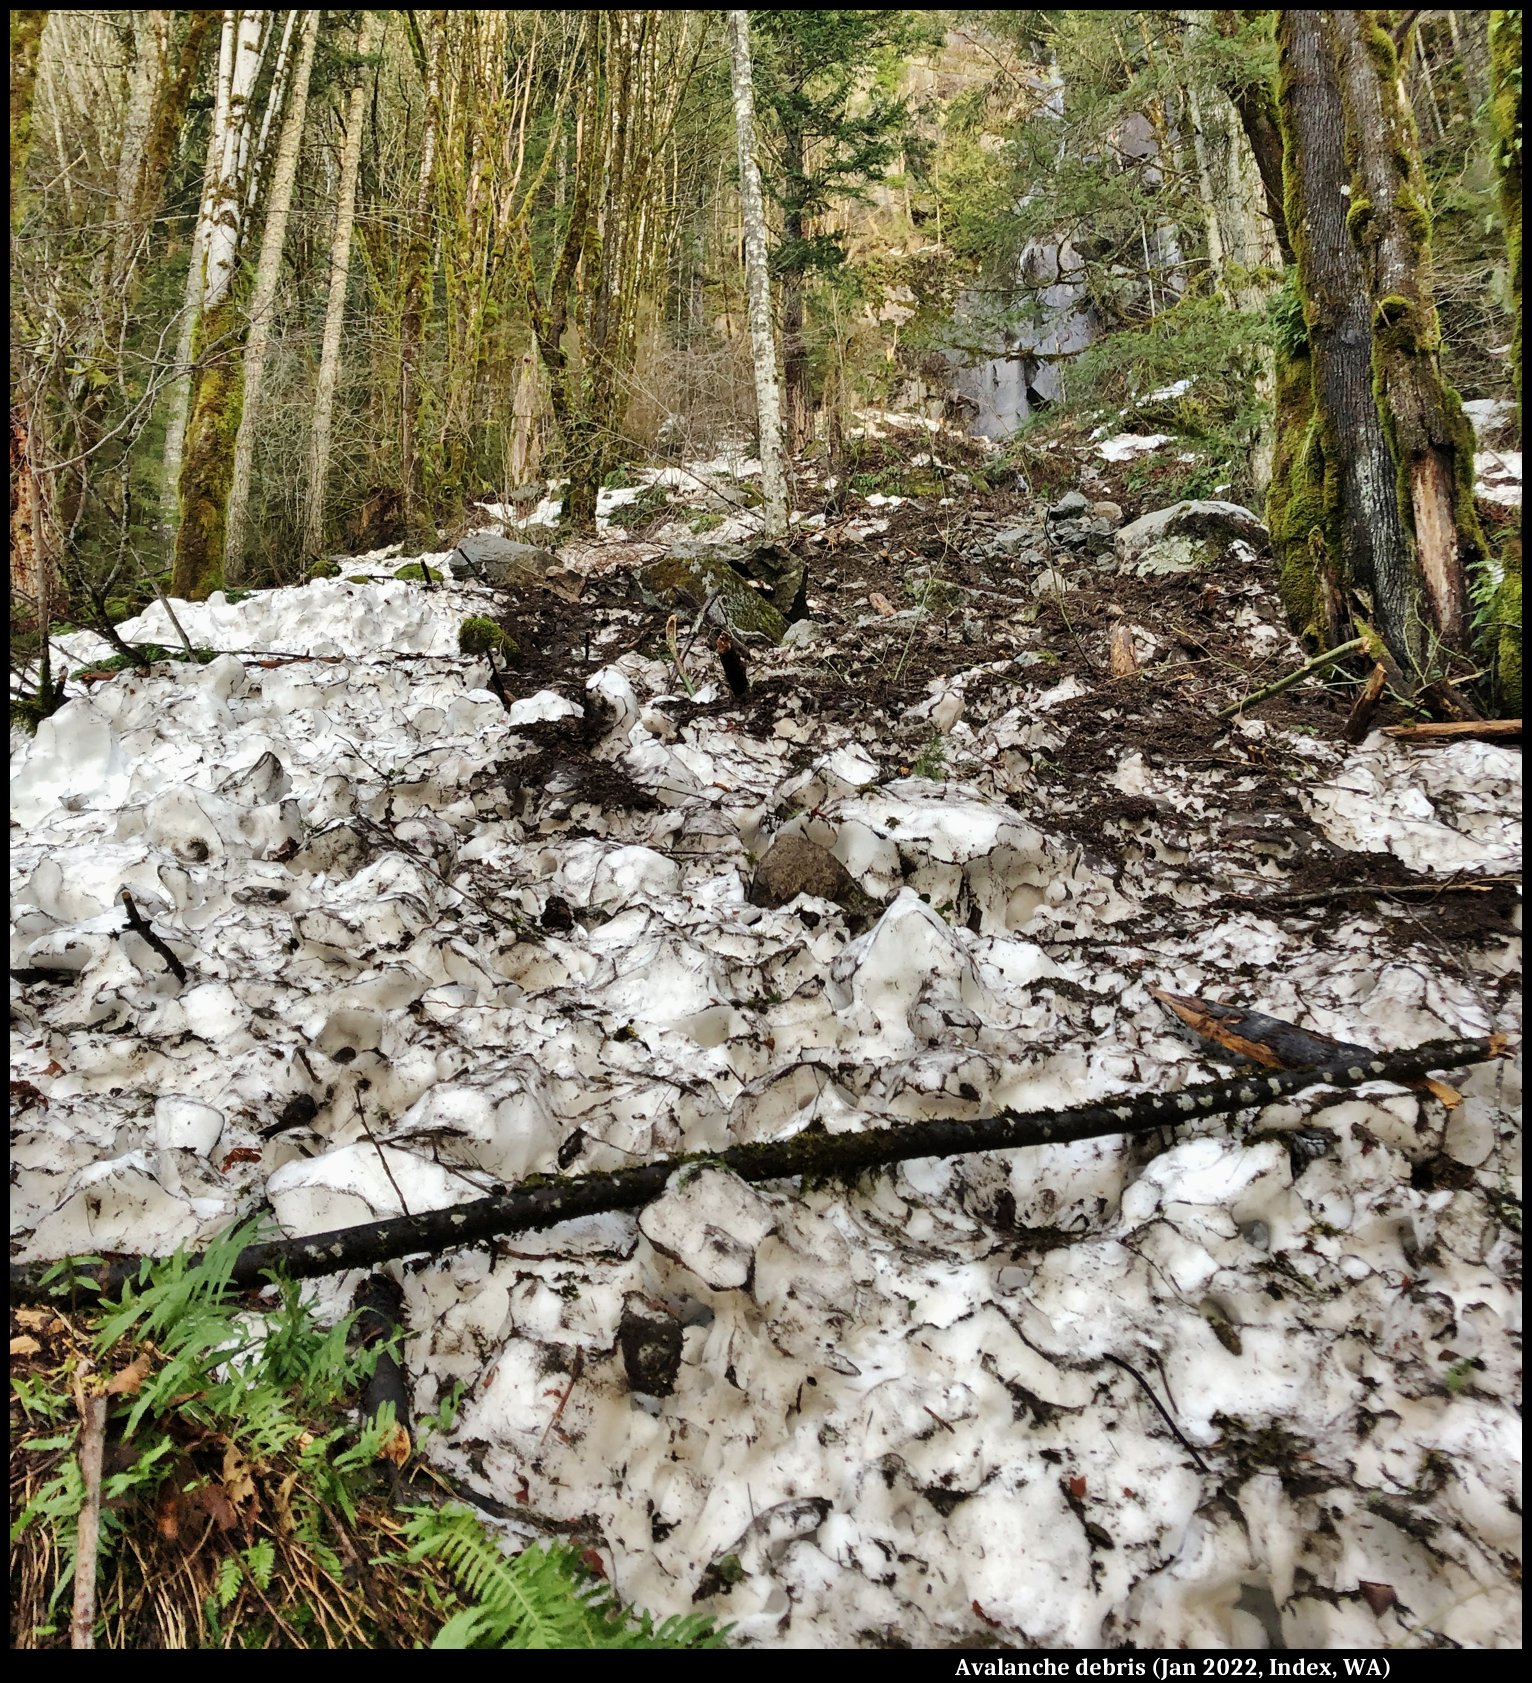
You can see in that picture that considerable debris was present in that case, though it is unimportant for the present discussion.
An article I read last year about a similar event, yet on a vastly larger scale, reported quite the opposite: the ice melting by its tumbling fall down the mountain. Here is the relevant excerpt:
Ice Classification System of Bentley
February 24th, 2022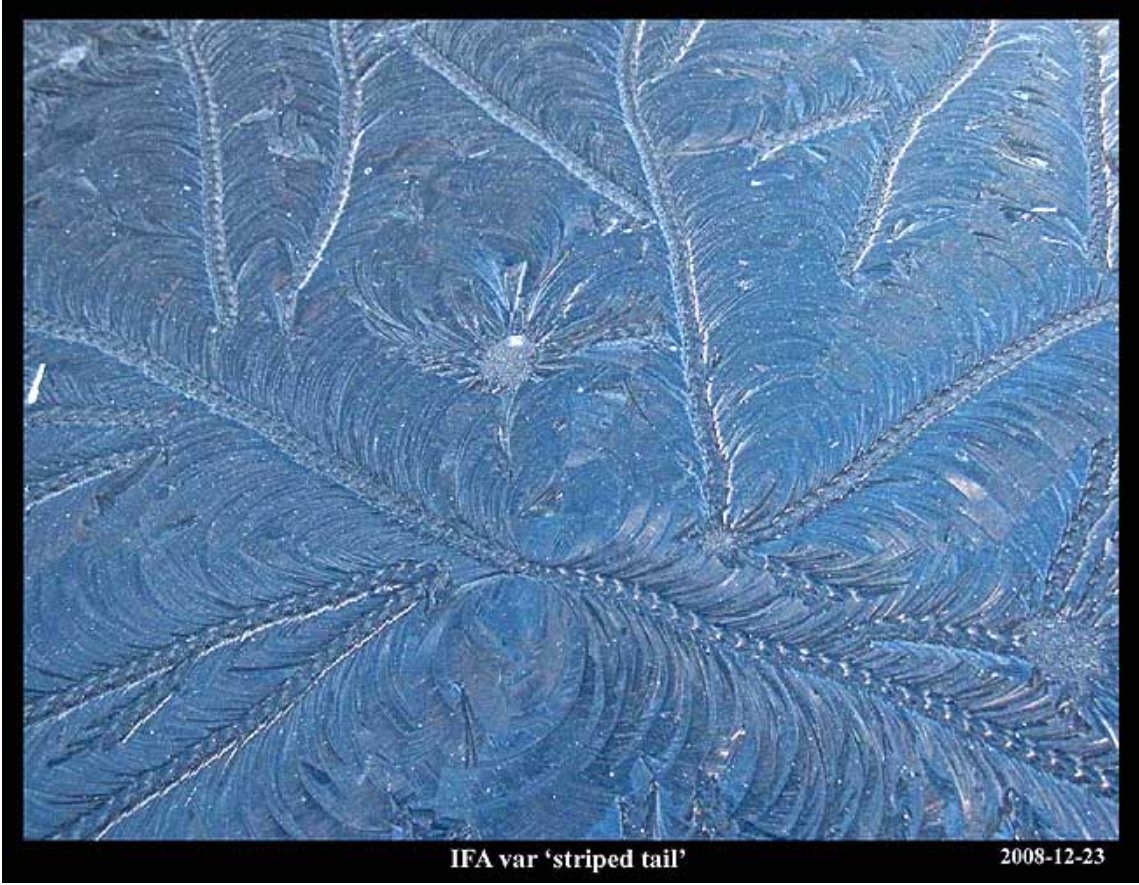
[This is the fifth in the series of re-posted articles, from 2010.]
The most comprehensive study of frost and small ice formations was published way back in 1907 by Wilson A. Bentley. His article was split into five successive issues of the Monthly Weather Review (1) with the title “Studies of Frost and Ice Crystals”. In the article, Bentley details his classification system for frost and some related ice forms, and gives examples of nearly every type – in total 274 examples in photographs. His classification system is ingenious, the first (and probably only) classification system for frost and ice on surfaces. Unfortunately for such an extensive, pioneering article, few books or articles reference it.
Snow Crystal Variety and the Bentley Length Scale in Clouds
February 22nd, 2022[This is the fourth of the re-posted articles, from 2009.]
“… by means of these wonderfully delicate and exquisite figures, much may be learned of the history of each crystal and the changes through which it has passed in its journey through cloudland.”
W. A. Bentley, 1898
“… the crystals will in all probability be greatly modified by passing through atmospheric strata varying so greatly in density, temperature, humidity, etc. That they are greatly modified by these flights in the cloud is clearly shown by the interior structure of many of the crystals. ”
W. A. Bentley, 1901
Long ago, Wilson Bentley argued that the various layers (‘strata’) of air that a snow crystal falls through largely determine the appearance of the crystal. The first direct support of this claim came about 30 years later, from laboratory experiments by Ukichiro Nakaya, a Japanese physicist. Now, 100 years later, probably all cloud scientists would agree with Bentley. So, with all the crystal and cloud research that has been done since Bentley and Nakaya, can we determine the history of a crystal if we see its form? Can we finally do what Bentley said we should be able to do?
